")
")
| Issue |
OCL
Volume 30, 2023
|
|
|---|---|---|
| Article Number | 27 | |
| Number of page(s) | 14 | |
| Section | Agronomy | |
| DOI | https://doi.org/10.1051/ocl/2023027 | |
| Published online | 19 décembre 2023 | |
Research article
Impact of deficit irrigation on the physiological and agronomic traits of 24 safflower (Carthamus tinctorius L.) genotypes grown in Iran
Impact de d’une irrigation déficitaire sur les caractères physiologiques et agronomiques de 24 génotypes de carthame (Carthamus tinctorius L.) cultivés en Iran
1
Department of Agronomy, Science and Research Branch, Islamic Azad University, Tehran, Iran
2
Department of Agronomy, Arak Branch, Islamic Azad University, Arak, Iran
3
Agricultural Biotechnology Research Institute of Iran (ABRII), Agricultural Research, Education and Extension Organization (AREEO), Karaj, Iran
* Correspondence: Cette adresse e-mail est protégée contre les robots spammeurs. Vous devez activer le JavaScript pour la visualiser.
; Cette adresse e-mail est protégée contre les robots spammeurs. Vous devez activer le JavaScript pour la visualiser.
Received:
23
June
2023
Accepted:
10
November
2023
Abstract
The impact of two irrigation regimes (well-watered versus water limited conditions) on yield and grain composition of 24 safflower genotypes was compared in a two-year field trial arranged as a split plot design. Safflower genotypes at limited irrigation had higher total chlorophyll and proline levels compared with well-watered irrigations. In term of total chlorophyll content, safflower genotypes G17 (1.4 mg g-1 FW), G24 (1.37 mg g-1 FW) and G7 (1.36 mg g-1 FW) were statistically higher relative to other genotypes under well water conditions. In contrast, under limited irrigation conditions, G15 (1.76 mg g-1 FW) had the highest total chlorophyll suggestive of differential response among genotypes. The highest plant height and leaf dry weight were detected in G3 (84.4 cm and 13.3 g plant-1, respectively) under limited irrigation. Difference in number of heads plant-1 under well-watered (29.5 plant-1) was observed compared to limited irrigation (20.5 plant-1) among genotypes. Under well-watered (49.8 g) and limited irrigation (44.1), G2 and G9 showed the highest 1000 seed weight, respectively. Among accessions, G24 yielded more seed compared to other genotypes under well-watered (2342 kg ha-1) and limited irrigation (1137 kg ha-1) posing it as potential line for further breeding. With regards to seed oil yield, G23 was the highest under well-watered (735 kg ha-1) and water limited conditions (356 kg ha-1), with water limited conditions found to reduce seed oil content by ca. 1.5% among lines. Under both well-watered and water limited conditions, highest biological yield (14003 and 11238 kg ha-1, respectively) and lowest harvest index (6.9% and 6.1%) were detected in G3 genotype. Based on this experiment, it is could be concluded that under well and limited irrigation, high seed yield and oil yield was achieved in G23, while seed oil concentration did not change remarkably by stress conditions.
Résumé
L’impact de deux régimes d’irrigation (assurant les besoins versus limité) sur le rendement et la composition des graines de 24 génotypes de carthame a été comparé dans un essai au champ de deux ans conduit en split plot. Les génotypes de carthame soumis à une irrigation limitée présentaient des niveaux de chlorophylle totale et de proline plus élevés que ceux bénéficiant d’une irrigation suffisante. Les génotypes G17 (1,4 mg g−1 de poids frais), G24 (1,37 mg g−1 de poids frais) et G7 (1,36 mg g−1 de poids frais) présentaient des teneurs en chlorophylle significativement plus élevées que les autres génotypes en conditions d’arrosage suffisant. En revanche, en conditions d’irrigation limitées, c’est le génotype G15 (1, 76 mg g−1 de poids frais) qui présentait la teneur en chlorophylle la plus élevée, suggérant une réponse différentielle selon les génotypes. La hauteur de plante et le poids sec de feuilles étaient les plus élevés pour le génotype G3 (84,4 cm et 13,3 g plante−1, respectivement) sous irrigation limitée. Une différence du nombre de capitules par plante a été observée sous irrigation suffisante (29,5 plante−1) par rapport à une irrigation limitée (20,5 plante−1) en moyenne pour tous les génotypes. Les poids de 1000 graines les plus élevés ont été observés pour les génotypes G2 (49,8 g) et G9 (44,1 g) sous irrigation correcte et limitée respectivement. Parmi les accessions, G24 a produit plus de graines que d’autres génotypes sous un arrosage non limitant (2 342 kg ha−1) et sous irrigation limitée (1 137 kg ha−1), ce qui en fait une lignée potentielle pour une sélection ultérieure. En ce qui concerne le rendement en huile des graines, le génotype G23 était le plus performant dans des conditions d’arrosage adapté (735 kg ha−1) et limitées en eau (356 kg ha−1), ces dernières réduisant la teneur en huile des graines d’environ 1,5% pour l’ensemble des génotypes. Le rendement biologique le plus élevé (14 003 kg ha−1et 11 238 kg ha−1) et l’indice de récolte le plus faible (6,9% et 6,1%) ont été détectés pour le génotype G3 dans des conditions bien arrosées et limitées en eau, respectivement.Sur la base de cette expérience, on peut conclure que sous irrigation correcte et limitée, un rendement élevé en graines et en huile a été obtenu pour le génotype G23, tandis que la teneur en huile des graines n’a pas changé de façon remarquable en conditions de stress.
Key words: drought / seed oil content / water stress / pigment content
Mots clés : sécheresse / teneur en huile / stress hydrique / teneur en pigments
© S.M. Seify et al., Published by EDP Sciences, 2023
 This is an Open Access article distributed under the terms of the Creative Commons Attribution License (https://creativecommons.org/licenses/by/4.0), which permits unrestricted use, distribution, and reproduction in any medium, provided the original work is properly cited.
Highlight
In drought stress conditions, leaf dry weight plays an important role in maintaining yield.
Seed oil content did not change remarkably by stress conditions.
Under drought conditions, plant be more involved in roots expansion in order to increase water absorption.
Any factor that reduces number of plant heads will lead to a decrease in final plant yield.
1 Introduction
Drought is one of the major abiotic stresses which threatens crop productivity worldwide (Keshavarz Mirzamohammadi et al., 2021a). More than 60% of agricultural production suffers from drought stress (Karami et al., 2016). Furthermore, water deficit at any stage of crop growth can make an irreversible loss in yield (Sabourifard et al., 2023). Water deficit have indeed an impact on the growth and yield development stage which varies in response based on species and variety type, varying from great sensitivity to high tolerance (Noleto-Dias et al., 2023). Generation of reactive oxygen species (ROS) such as peroxide hydrogen (H2O2), superoxide anion (O2−) and hydroxyl radicals is the first consequence of water deficit stress which takes place in mitochondria and chloroplast.
Safflower (Carthamus tinctorius L.) a plant native to Iran (Moradi-Ghahderijani et al., 2017) is one of the oldest cultivated crops worldwide that is grown for its flowers used as natural coloring, food flavor asides from its several medicinal properties (Hosseini et al., 2023b). Increasing interest has been given towards safflower seed oil owing for its nutritive value and ability to grow under high temperatures, drought, and salinity (Bortolheiro and Silva, 2017). Safflower seed oil is enriched in unsaturated fatty acids ca. 78–90% especially oleic acid and linoleic acid presenting several health outcomes. Safflower is cultivated in arid and semi-arid regions with rainfall average of 280–380 (mm) that can be appropriate for cultivating safflower in the germination stage. Previous studies have revealed that the best oilseed crop to overcome water deficit stress and to grow in areas suffering from water stress is safflower among others (Alizadeh-Yeloojeh et al., 2020). Stress in the reproductive development reduced the number of fertile seeds, number of seed head−1, 1000 seed weight, seed yield, and oil yield (Ali et al., 2013) suggestive for the need to identify stress tolerant lines in safflower. Further, Amini et al. (2014) reported that safflower oil percentage is affected by irrigation regimes, with increase in oil yield by increasing the rate of irrigation. In contrast, slight changes in seed oil content with different water treatments was reported by Mahdavi et al. (2011). Due to its strong and deep taproot and its small leaves with thick cuticles, safflower is classified as a drought tolerant plant (Harsányi et al., 2021) and with respect to its unique tolerance capacity, need for developing new genotypes in safflower for future breeding program seems warranted. In a large scale field study over two years this study reports on the physiological traits, seed and oil yield of 24 safflower (Carthamus tinctorious L.) genotypes under optimal irrigation and water restricted conditions. Such comparative study aided to identify the best drought tolerant genotypes versus best genotypes under optimal irrigation conditions in safflower for the first time.
2 Materials and method
2.1 Study site and experimental design
The study was conducted in two cropping seasons (2019 and 2020) in the Farm Research of the Agricultural Faculty of Arak Islamic Azad University (Khomein road) with a latitude of 36° and 15’ North and a longitude of 59° and 23’ East and an altitude of sea level of 1708 meters. The experiment was performed in split plot based on a randomized completely block design with three replications. The irrigation regimes (full irrigation: plants irrigated to field capacity when 25% of soil available water was depleted; water stressed treatment: plants irrigated to field capacity when 25% of soil available water was depleted until stem elongation and then water withhold till end of the experiment) were randomized to the main plot units and the 24 safflower genotypes with alongside native verity were randomized in the subplot units. The 24 genotypes of safflower (Carthamus tinctorius L.) including: 28.11 Arak, 324.s6.697, 32.88 cgl, 34.14.73, 346-s6.687,3-8-36.60.11, 86-56-58-697, Faraman, irv-55-55, pi 199888, pi 253384, pi 262444, pi 405985, pi 559909 (acstirling), Sina, Snc-1, Syrian, Esfahan 10, Eslamabad 3.14, Hybridization, Darab No.6, Diz 56, Zarghan 279, Maraghe (autumn crop) and Ch 353 denoted as G1, G2, G3, G4, G5, G6, G7, G8, G9, G10, G11, G12, G13, G14, G15, G16, G17, G18, G19, G20, G21, G22, G23 and G24, respectively. The monthly mean of rainfall and temperature were recorded and depicted in Figure 1.
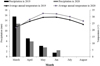 |
Fig. 1 Average monthly air temperature and precipitation during the period of March–August in 2019 and 2020. |
2.2 Field preparation and plots establishment
In this study, after the preparation of bedding includes plowing, land leveling and preparing furrows, plots were constructed in a 3 m long and consisted of six rows, with 50 cm spacing between the rows and 10 cm intra row spacing. A 2 m alley was maintained between all main plots to eliminate any influence of lateral water movement. Plots were irrigated by drip irrigation pipes (with drippers spacing of 5 cm). The irrigation system was designed to spray 45 liters of water h−1 m2 at 1.5 atm. At both crop season planting date was started on March 23, and immediately after planting in order to observe the uniform farm emergence, irrigation of the whole research farm was carried out.
To record the soil water content (θv), the TDR (Time Domain Reflectometry) Model TRIME-FM, Germany was used. For this purpose, the soil water content in full irrigation soil was recorded before the experiment and the percentage depletion of field capacity water was determined using the equation (Keshavarz Mirzamohammadi et al., 2021a) (1):
 (1)
(1)
where MAD is maximum allowable depletion (0.45), FC is the soil moisture at field capacity (21.7% by volume), θ is the soil moisture measured by TDR and PWP is the soil moisture at wilting point (8.2% by volume).
The required volume of water (Vd, mm) was estimated based on cumulative daily irrigation requirement (DIR) according to the method described by James (1988). For this method, equations (1), (2), (3), (4) and (5) were used:
 (2)
(2)
 (3)
(3)
where RAW is the readily available water (by mm), TAW is the total available water, and Rz is the effective rooting depth (by mm). The irrigation regimes (full irrigation: plants irrigated to field capacity when 25% of soil available water was depleted; water stressed treatment: plants irrigated to field capacity when 25% of soil available water was depleted until stem elongation and then water withhold till end of the experiment). Irrigation interval was determined based on RAW and cumulative DIR.
The DIR was calculated using equation (4):
 (4)
(4)
where ΔSW is the daily change in soil water content measured by TDR at the root zone and Etc is crop evapotranspiration (mm). Etc calculated by FAO56 method (Allen et al., 1998) using equation (5):
 (5)
(5)
where Eto is reference evapotranspiration, which depends on daily weather condition at the experimental site and Kc is the crop coefficient which calculated by the FAO (Doorenbos and Kassam, 1977).
Every week the manual removal of weeds was practiced. The required nitrogen content of safflower was set at 70 kg N ha−1, of which 50 kg N ha−1 was used at the stem elongation and 20 kg N ha−1 at the budding stage as sulfur-coated urea according to local recommendation.
2.3 Data collection
At the flowering stage, leaves were collected to determine the total chlorophyll and proline content. Proline content was measured following the procedure of Bates et al. (1973) using sulfosalicylic acid and ninhydrin reagent. Final reading was measured at 520 nm and proline concentration was determined in mg g−1 FW using standard curve of proline. Total chlorophyll content was determined using the exact procedure of Arnon (1949) using this equation:
 (6)
(6)
The monitored agronomic traits included plant height, leaf dry weight (LDW; g plant−1), number of head (per plant), 1000-seed weight (g), seed yield (kg ha−1), biological yield (kg ha−1), seed oil content (%) and oil yield (kg ha−1). The number of head was counted in 5 plants and then divided per plant number for obtaining the number of head in each plant. In order to determine the 1000 seed weight, 1000 seed weight of each genotype was counted using seed numbering machine and their weights were measured. The total aerial parts of each plot were cut from plants above the soil surface and were dried in an oven set at 72 ∘C for 24 h, and dry weight of 10 plants was converted to kg ha−1 as biological yield. Seeds of each plot were harvested from the 4 rows of the middle by considering the margin and dried in an oven at 72 ∘C for 24 h, and then seed dry weight was converted to kg ha−1 and accounted as kg seed yield ha−1. Seed oil content was obtained from 20 g samples from each genotype using NMR and then it was converted to oil percent and oil yield (kg ha−1). The harvest index was calculated by dividing seed yield to biological yield and presented as relative percentage.
2.4 Statistical analysis
As errors of main plots and subplot plots for all safflower traits in the two years study were homogeneous in Bartlett’s test, variance analysis of traits was performed for the two years. Analysis of variance (ANOVA) of the data from each attribute was computed using SAS package (SAS Institute, 2002). Significant of differences among irrigation regimes (IR), various genotypes (G) and their interaction (IR×G) for variables were compared using LSD test (P≤0.05). Principal component analysis (PCA) and general correlations (with Pearson’s correlation coefficients) between parameters were examined with SAS (Hosseini et al., 2023a). Clustering was performed in S-PLUS ver. 6.1 software (Insightful Corporation, USA).
3 Results
3.1 Principal component analysis (PCA) and cluster analysis (CA)
The results of PCA (Fig. 2) showed that the first and second components had an eigenvalue higher than one and were selected as effective components. Under well watered conditions, the first and second components had the highest relative variance with 20.63 and 31.71%, respectively, and accounted for 52.34% of the total variance. The biplot obtained from the first and second components showed that genotypes of G3, G4, G5 and G15 were placed in the same group due to their high affinity and have a high correlation with plant height and leaf dry weight traits. In addition, genotypes of G23, G2, G22, G13, G21, G24, G8, G11 and G9 were placed in the same group due to their neighborhood and showed a strong correlation with proline content, 1000 seed weight, seed yield and seed oil yield traits. Under limited water conditions PCA showed that genotypes of G7, G9, G10, G17, G18, G20, G21, G22 and G24 were placed in one set due to their high affinity based on the measured traits and had a high correlation with total chlorophyll content. The dendrogram obtained from the CA under well-watered irrigation (Fig. 3) showed that the treatments in the present experiment were divided into three separate groups based on all the measured traits. Separation of different treatments in three separate clusters indicates the existence of a desirable diversity among the investigated treatments. In the first group, the largest number of genotypes (twelve treatments) included G6, G16, G13, G11, G21, G18, G19, G17, G20, G12, G1 and G10 were placed in one cluster due to their high affinity. In the second group, genotype of G3 was placed based on close proximity. CA separated eleven genotypes included G7, G14, G8, G22, G9, G5, G15, G4, G23, G2 and G24 due to high relatedness in the third cluster.
The dendrogram obtained from the CA under limited watered irrigation (Fig. 3) showed that the treatments in the present experiment were divided into three separate groups based on all the measured traits. Separation of different treatments in three separate clusters indicates the existence of a desirable diversity among the investigated treatments. In the first group, the largest number of genotypes (sixteen treatments) included G9, G18, G10, G17, G12, G19, G21, G14, G7, G2, G22, G8, G16, G24, G1 and G20 were placed in one cluster due to their high affinity. In the second group, genotype of G3 was placed based on close proximity. CA separated seven genotypes included G15, G4, G5, G6, G11, G13 and G23 due to high relatedness in the third cluster.
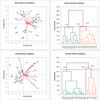 |
Fig. 2 The results of dendrogram based on cluster analysis (A) and biplot of first and second components based of principal component analysis in to years together (2019 and 2020). Y1: Total chlorophyll content, Y2: Proline content, Y3: Plant height, Y4: Leaf dry weight, Y5: Number of heads plant−1, Y6: 1000 seed weight, Y7: Seed yield, Y8: Biological yield, Y9: Seed oil content, Y10: Seed oil yield, Y11: Harvest index. G1: 28.11 Arak; G2: 324.s6.697, G3: 32.88 cgl, G4: 34.14.73, G5: 346-s6.687, G6: 3-8-36.60.11, G7: 86-56-58-697, G8: Faraman, G9: irv-55-55, G10: pi 199888, G11: pi 253384, G12: pi 262444, G13: pi 405985, G14: pi 559909 (acstirling), G15: Sina, Snc-1, G16: Syrian, G17: Esfahan 10, G18: Eslamabad 3.14, G19: Hybridization, G20: Darab No.6, G21: Diz 56, G22: Zarghan 279, G23: Maraghe (autumn crop), G24: Ch 353.https://doi.org/10.1016/j.indcrop.2023.117199 |
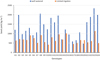 |
Fig. 3 Two-way interaction of irrigation regimes and genotypes on seed yield of safflower (Carthamus tinctorius L.) in two years together (2019 and 2020). |
3.2 Analysis variance results
The main goal of this study was to assess agronomic traits in safflower in context to different water regimes, significance for irrigation regimes, genotypes and two-way interaction for the studied traits are presented in Table 1. The main effect of year did not appear to be significant on all examined traits and to solidify hypothesis for effect of water stress on safflower plant. Combined analysis of variance on the data showed that main effects of irrigation regimes and genotypes were significant on all studied traits. Results also revealed that the interaction between irrigation regimes and genotypes was significant for all evaluated parameters, except for seed oil percentage (Tab. 1) as detailed in the next subsections.
Combined analysis of variance on some physiological and agronomic traits of safflower (Carthamus tinctorius L.) genotypes.
3.3 Physiological traits
The main effects of irrigation regimes and genotypes and their interaction were found significant on total chlorophyll and leaf proline content (Tab. 1). In well-watered conditions, the highest total chlorophyll content appeared in G17 (1.4 mg g−1 FW) followed by G24 (1.37 mg g−1 FW), G7 (1.36 mg g−1 FW) which were in a same statistical group (Tab. 2). In contrast, G4 (0.83 mg g−1 FW) and G8 (0.88 mg g−1 FW) showed the lowest total chlorophyll content in well-watered conditions (Tab. 2). Under water restricted conditions, G24 (1.88 mg g−1 FW) and G15 (1.76 mg g−1 FW) showed the highest total chlorophyll level compared with other genotypes. Averaged by genotypes, obtained total chlorophyll content from water restricted (1.30 mg g−1 FW) appeared slightly higher than well-watered conditions (1.11 mg g−1 FW) by 14.61%. Nevertheless, G24 and G15 were the superior genotypes in terms of total chlorophyll content (On average across two irrigation regimes).
The mean comparison revealed that average over the two irrigation levels, highest proline content was higher in water restricted compared with well water conditions by 8.98% (Tab. 2). As seen in Table 2, proline content in leaves was higher in G21 (2.96 mg g−1 FW), G2 (2.88 mg g−1 FW) and G9 (2.83 mg g−1 FW) under well-watered conditions (Tab. 2). Lowest total proline content was recorded in G7 (1.92 mg g−1 FW), G10 (1.97 mg g−1 FW) and G3 (1.99 mg g−1 FW) under well- watered conditions. Under water restricted conditions, highest and lowest proline levels were achieved in G13 (3.42 mg g−1 FW) and G4 (1.82 mg g−1 FW), respectively. Over all, averaged over both irrigation regimes, G19 (3.04 mg g−1 FW) and G7 (1.97 mg g−1 FW) had the highest and lowest proline content among all genotypes.
Mean comparison of interaction effect of irrigation regimes × safflower genotypes on studied traits sliced by irrigation regimes in two years together (2019 and 2020).
3.4 Plant height and leaf dry weigh
ANOVA results showed that the main effect of irrigation regimes, genotypes and interaction between them were significant on plant height and leaf dry weight (Tab. 1). Under well-watered condition, maximum plant height was observed in G15 (114.2 cm) versus minimum plant height in G11 (62.9 cm), G18 (63.4 cm), G12 (63.5 cm) and G9 (67.3 cm). As seen in Table 2, restricted water decreased plant height, with G3 to show maximum plant height by ca. 84.4 cm versus minimum plant height in G18 (53.8 cm), G9 (54.2 cm) and G22 (54.8 cm) with no statistical differences among the later lines (Tab. 2). When averaged across genotypes, maximum plant height was observed in lines grown under well-watered irrigations (86.21 cm) and to decrease by 19.04% in case of restricted irrigation regime. Among genotypes (on average a cross irrigation regimes), G15 (97.35 cm) and G18 (58.6 cm) showed the highest plant height, respectively.
Leaf dry weight significantly varied in safflower genotypes grown under normal and stress conditions (Tab. 1). G3 Exhibited the highest leaf dry weight in both well-watered and restricted irrigation regimes (13.9 g and 12.3 g, respectively), lowest leaf dry weight in well-watered and restricted irrigation regimes was obtained in G12 (3.06 g) and G10 (1.2 g). On average (across all genotypes) leaf dry weight was found higher under well-watered conditions (6.85 g) compared with limited irrigation (4.09 g). Among genotypes (on average a cross the irrigation regimes), maximum leaf dry weight was found in case of G3 (13.1 g) followed by G4 (10.0 g). Across studied safflower genotypes under well-watered conditions, the highest number of heads plant−1 was observed in case of G24 (29.5 plant−1) and to reduce by 69.49% under limited irrigation (Tab. 2). Under well-watered conditions, lowest number of head belonged to G19 (9.3 plant−1) followed by G13 (10.6 plant−1). Under limited water conditions, highest number of head was obtained in G14 (20.5 plant−1) which was almost as same as number of heads plant−1 of this genotype under well water conditions. Averaged across genotypes, limited water led to 31.9% reduction in terms of head numbers per plant. It is worth noting that on average (well-watered and limited water conditions), highest and lowest number of heads plant−1 was detected in G8 (21.35 plant−1), G19 (8.65 plant−1) (Tab. 2).
3.5 Seed yield and yield components
The weight of 1000 seed weight significantly varied in safflower genotypes grown under well- watered and limited irrigation conditions (Tab. 1). Under well-watered conditions G2 (49.8 g), G10 (48.08 g) and G22 (49.04 g) exhibited the highest 1000 seed weight (Tab. 3). In contrast, G1 (30.1 g) showed the lowest 1000 seed weight under limited irrigation. When average across irrigation regimes, the maximum and minimum 1000 seed weight were detected in G22 and G3 at 43.37 and 33.35 g. It is worth mentioning that on average (all genotypes), weight of 1000 seed was found higher under well-watered conditions than limited irrigation by (9.7%).
Seed yield achieved in all genotypes affected by irrigation regimes in both years (Tab. 1). On average (all genotypes), seed yield was significantly decreased under limited irrigation conditions and seed yield was about two times higher under well-watered conditions (1344.9 kg ha−1) than limited irrigation (687.9 kg ha−1). The minimum and maximum seed yield was obtained in G20 and G23 at an average of 469.5 kg ha−1 and 2342.1 kg ha−1, respectively under well-watered condition (Tab. 3). Under limited irrigation, highest seed yield was achieved in G23 (1,136.8 kg ha−1) which was though lower than well-watered condition by 51.46% (Fig. 3). However, the lowest seed yield was achieved in G1 (414.1 kg ha−1) followed by G17 (449.7 kg ha−1). Over all, the highest and lowest seed yield (averaged across irrigation regimes) was detected in G23 (1,739.45 kg ha−1) and G17 (518.8 kg ha−1), respectively (Tab. 4).
In well-watered and limited irrigation regimes, G3 showed the highest biological yield by average of 14,002.6 kg ha−1, respectively suggestive that irrigation reduced biological yield by 19.7% (Tab. 4). In contrast, the lowest biological yield under water limited conditions was observed in case of G9 (2,939.0 kg ha−1). Averaged over both irrigation regimes, biological yield was higher as expectedly in well-watered conditions (10,238.7 kg ha−1) compared with water limited irrigation (6441.5 kg ha−1) by 37.08%. Averaging across irrigation regimes, maximum and minimum biological yield was found in G3 (12,620.5 kg ha−1) and G18 (5482.5 kg ha−1), respectively.
The main effect of irrigation regimes was significant on seed oil content to reduce by 1.55% under limited irrigation (Tab. 3). Among these genotypes, G12 and G17 showed the highest seed oil content by ca. 32.8% (Fig. 4). In contrast, lowest seed oil content was detected in case of G11 (30.6%) which was 6.7% lower than superior genotype (Tab. 3).
As seen in Table 3, limited water irrigation decreased seed oil yield in all study genotypes. Results showed that under well water conditions, highest (735.2 kg ha−1) and lowest (153.2 kg ha−1) seed oil yield was obtained detected in G23 and G20, respectively (Tab. 3), with 51.2% reduction in seed oil yield under limited irrigation. In addition, the lowest seed oil yield was detected in G10 (128.7 kg ha−1) under limited irrigation (Tab. 3). Averaged over the two irrigation regimes, highest (545.8 kg ha−1) and lowest (170.3 kg ha−1) seed oil yield was observed in G23 and G17, respectively.
Under well water conditions, highest harvest index was achieved from G13 by ca. 22.2% (Tab. 3). In contrast, lowest harvest index was detected in G20, G14 and G3 by average of 5.8%, 6.6% and 6.9%, respectively. Results of the current study revealed that G9 produced higher harvest index compared to other genotypes under limited water irrigation owing to lowest biological yield (2939.0 kg ha−1). Averaged over the two irrigation regimes, G8 (16.8%) and G9 (16%) were identified as superior genotype, G3 (6.5%) showed the lowest harvest index. When averaged across genotypes, the harvest index was at 13.3% under well-watered irrigation and reduced by 15.7% under limited water irrigation.
Mean comparison of interaction effect of irrigation regimes × safflower genotypes on studied traits sliced by irrigation regimes in two years together (2019 and 2020).
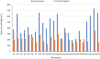 |
Fig. 4 Two-way interaction of irrigation regimes and genotypes on seed yield of safflower (Carthamus tinctorius L.) in two years together (2019 and 2020). |
3.6 Correlation results
There were high and significant correlation between plant height and leaf dry weight and harvest index in well-watered treatment. The significant correlation was obtained between seed oil yield and number of heads plant−1, 1000-seed weight, seed yield and biological yield in well-watered treatment. However, correlation between harvest index and number of heads plant−1, and seed yield were 0.23, 0.78 and −0.22, respectively (Tab. 5).
It shows that the effects of plant height and seed yield was greater than leaf dry weight and number of heads plant−1 in limited irrigation. Table 5 showed that in limited irrigation, most correlation biological yield and seed oil yield were seen by leaf dry weight (0.81) and seed yield (0.99), respectively (P≤0.05). There were high correlations between plant height and biological yield in limited irrigation (P≤0.05, 0.60).
Mean comparison of irrigation regime and genotype treatment main effect.
Correlation analysis between different studied traits for the two irrigation regimes in two years together.
4 Discussion
Safflower (Carthamus tinctorius L.), indigenous to Asia, is regarded as one of the oldest agricultural productions attributed mostly for its myriad of applications i.e., culinary, textile coloring, ornamental, cosmetics, medicine asides from its high tolerance to stress conditions. This study provides the first comparative approach to differentiate safflower genotypes subjected to drought stress by measurement of several agronomic traits i.e., plant height, seed yield, and drought stress markers i.e., proline and chlorophyll levels. Total chlorophyll content represents an important indicator that can be used to measure chlorophyll loss in plants under environmental stresses (Yousefzadeh et al., 2023). Chlorophyll content is one of the key factors in plants photosynthetic capacity and plants dry matter as it directly affects the amount and the photosynthesis rate of the plant (Keshavarz Mirzamohammadi et al., 2021b). Besides, water deficit is responsible for pigments loss denoting that susceptible plants tend to encompass reduced chlorophyll content concurrent with reduction in leaf photosynthetic activity (Keshavarz, 2020). Decrease in chlorophyll content in drought-stressed plants might possibly be attributed for changes in lipid protein ratio of pigment-protein complexes or increased chlorophyllase activity (Rah Khosravani et al., 2017). Decrease in total chlorophyll content by drought induction in bean (Phaseolus vulgaris L.) imply that light harvesting complexes of thylakoid membranes are affected by short-term of drought increments (Keshavarz and Khodabin, 2019). In case of safflower, a study on 64 safflower genotypes exposed to water deficit conditions revealed that cultivars with low seed yield were characterized by low chlorophyll level (Amini et al., 2014), and posing for chlorophyll content as potential marker for selecting a stress-tolerant variety in safflower.
Another more characterized marker for drought stress is proline amino acid, with results in safflower revealing further that proline content was negatively and significantly correlated with number of heads plant−1, and 1000 seed weight (although later is not significant) (Tab. 5). These results suggest that under drought conditions, number of heads plant−1 decreased with increase in proline level mediated by activation of photosynthetic machinery towards physiological defenses system to protect against environmental conditions (drought stress). Increased proline level is a well characterized defense mechanism for plants by which intracellular osmotic regulation plays a role in eliminating hydroxyl radicals, protecting enzymes from degradation, cell membrane and protein structure to overall improve plants tolerance to stress (Keshavarz and Sadegh Ghol Moghadam, 2017).
Limited water stress decreases plant height and consequently decreases seed yield (r = 0.39; p ≤ 0.01) (Tab. 5) by decreasing photosynthesis and ultimately lack of photosynthesis products. Occurrence of drought stress in safflower was associated with reduced photosynthesis due to lack of water and plant nutrients which resulted in lower plant height and seed yield as observed in this study and in accordance with Chavoushi et al. (2019). Decrease in plant height due to drought stress can be attributed to photosynthetic disturbance due to water scarcity and deficiency of photosynthetic products to provide growing parts of the plant and finally lack of the plant capacity to grow (Chavoushi et al., 2020). Water limited conditions increases competition between the different parts of the plant and under such limited conditions, plant allocates a greater share of photosynthetic products toward roots (Mahdavi et al., 2011) with less to reach aerial parts including stem, which reduces the plant height (Keshavarz et al., 2021). Another reason for less plant height under limited water conditions is the low turgor pressure and the aging of most leaves along with a decrease in cell growth (Yousefzadeh et al., 2023). In contrast, under well-watered conditions, plant height was found to be negatively correlated with number of heads plant−1 (r = −0.58, p ≤ 0.01) and seed yield (r = −0.2, p ≤ 0.05), versus positive correlation with leaf dry weight (r = 0.53, p ≤ 0.01), and biological yield (r = 0.33, p ≤ 0.01) (Tab. 5). In fact, partitioning of assimilates into excess vegetative structures can significantly reduce safflower yield. Well-watered conditions also cause competition between vegetative and reproductive parts and in this regard, plant allocates more material to the vegetative part rather reproductive part which leads to negative correlation between plant height and yield components (Sabourifard et al., 2023), and confirmed in case of safflower.
Previous studies indicated that drought stress at flowering stage significantly reduced the number of heads plant−1 mostly due to a reduction of secondary heads (Amini et al., 2014; Chavoushi et al., 2020). Increasing drought led to a decrease in heads plant−1 due to the decrease in plant height, lateral branches and safflower growth period (Ali et al., 2013). Therefore, any factor that reduces number of plant head by reducing the availability of photosynthetic inputs will ultimately lead to a decrease in final plant yield. In case of drought stress, production and supply of photosynthetic materials are reduced. Failure to provide sufficient photosynthetic materials to heads, reduces the number of heads which is one of the most important components of safflower yield and ultimately leads to a decrease in seed yield, and likely its flower as major product of that plant.
Evaluation of internal and external germplasms of safflower revealed that only the number of heads plant−1 was significant in yield components, with such trait showing greatest effect on increasing or decreasing of the yield level (Alizadeh-Yeloojeh et al., 2020). Averaged across genotypes, the number of plant heads showed increase under well-watered conditions versus reduction of 31.9% in the number of heads plant−1 under limited irrigation conditions. Such decrease in the number of plant heads could be attributed to a decrease in the number of lateral branches under drought stress conditions (data not shown). Due to the high diversity of this trait in this study, genotypes with higher number of heads could be selected for the indirect selection of the yield.
With regards to changes in seed weight and oil yield in response to drought stress, results revealed that increased plant photosynthetic capacity led to increased seed weight as more photosynthetic materials is sent to reproductive parts i.e., seed (Keshavarz et al., 2016). In contrast, limited water stress at reproductive growth stage and seed filling stage caused a reduction in water and solute absorption, concurrent with less production and transport of photosynthetic materials to the plants main reservoirs (seeds) and to a decrease in weight of 1000 seeds as observed in this study.
Under well-watered conditions, positive and significant correlations with plant height (r = 0.33; p ≤ 0.01), leaf dry weight (r = 0.57; p ≤ 0.01), number of heads plant−1 (r = 0.28; p ≤ 0.01), and seed yield (r = 0.39; p ≤ 0.01) (Tab. 5) confirms that plants showed high yield under conditions at which plants are able to store more photosynthetic materials in their organs due to their growing conditions. In other words, increasing plant resources and photosynthetic levels produce stronger and more resources or the existing resources are fully completed.
It has been reported that reduction in photosynthesis rate in maize plant during drought stress was due to a decrease in Rabisco enzyme activity, as this enzyme is a major protein in leaf likely downregulation with overall protein production upon stress and to further decrease maize photosynthesis rate (Bortolheiro and Silva, 2017; Keshavarz et al., 2018). In contrast, under interrupted irrigation interruption significant effects on total dry weight was observed in comparison with optimum irrigation at safflower different growth stages i.e., germination, flowering, maturity (Mahdavi et al., 2011). Under drought stress conditions, plant appear to be more involved in allocating materials towards photosynthetic organs and roots in order to increase water absorption. Biological yield, depends largely on plant height and by decreasing the plant height in safflower, the number of main and lateral branches and biological yield showed an expected decrease as well as revealed from our study.
A strong positive correlation between number of plant heads (r = 0.59; p ≤ 0.01) and seed weight (r = 0.47; p ≤ 0.01) (Tab. 5) with seed yield, and in accordance with previous reports Chavoushi et al. (2019). Harsányi et al. (2021) and Chavoushi et al. (2020) reported that under stress conditions, seed yield decreased due to a decrease in number of heads and number of seeds per head in safflower. Underlying physiological mechanism for drought stress in safflower likely attributed to reduction of leaf water content and stomata closure on one side to decreasing yield of photosynthetic components that ultimately leads to a reduction in seed yield (Amini et al., 2014).
The seed oil content decreased under limited water in safflower which appears to be due to a decrease in the amount of photosynthesis products by reduction in leaf dry weight (r = 0.28, p ≤ 0.01) (Tab. 5) which resulted in lower energy to be provided for oil biosynthesis, which has yet to be confirmed using molecular tools targeting gene expression involved in oil production. In other words, the costs of plant adapting to stress conditions such as osmotic regulation led to a decrease in energy needed to build materials which require more energy such as oil and thus leads to a decrease in oil content. Another mechanism in safflower decline in oil level with drought stress is that water shortage stress leads to a disruption in seed filling and a reduction in oil accumulation (Sabourifard et al., 2023).
5 Conclusions
In conclusion, higher number of heads per plant ensures higher seed yield, in all safflower genotypes although the 1000 seed weight was not significantly correlated to other parameters. However, safflower genotypes in limited irrigation consistently resulted in less seed and oil yield than safflowers planted in the well-watered conditions. In both irrigation regimes, safflower genotype G23 resulted in higher seed yield which resulted in higher seed oil content posing it potential line for further breeding. Despite variances in the number of heads plant−1, seed yield and biological yield among the years and irrigation, there were similarities in trends of genotypes and the seed yield and biological yield were more in G23 and G3, respectively than other genotypes. Among safflower genotypes, G23 had the highest seed oil content at both irrigation regimes. In case of harvest index, G3 had the lowest harvest index due to higher biological yield in this genotype. Moreover, water limited conditions reduced seed oil content by 1.55% compared to well water conditions. In the well watered conditions, G23 had a higher seed yield than other genotypes, and according to the correlation results in the well watered conditions, the higher seed yield of this genotype can be attributed to the higher number of pods per plant. On the other hand, in the conditions of limited irrigation, the cultivar G23 still had a higher yield, which was due to the higher plant height, higher leaf dry weight (photosynthesizing area) and finally higher number of pods per plant. It may be concluded from this study that high water shortage stress limited photosynthetic products yield and yield components potential but the range of seed oil content slightly changed through the irrigation regimes. The results obtained herein can be used for earlier identification of tolerant clones in safflower and to enhance the understanding of the correlation among detected agronomic, biochemical traits and drought tolerance.
Conflict of interest
The authors declare that they have no conflict of interest.
Funding
This research did not receive any specific grant from funding agencies in the public, commercial, or not-for-profit sectors.
Data availability
The datasets used during the current study available from the corresponding author on reasonable request.
Authors contribution
S-M. S.: designed and performed the experiment. H.M. : wrote the manuscript. S-S. P. and Gh. N-M.: improved the language. M.Ch.: helped in revising the manuscript. All authors have read and approved the final manuscript and agreed to the published version of the manuscript.
References
- Allen RG, Pereira LS, Raes D, Smith M (1998) Crop evapotranspiration ? Guidelines for computing crop water requirements ? FAO Irrigation and drainage paper 56. Food and Agriculture Organization of the United Nations, Rome, Italy: FAO. [Google Scholar]
- Ali Q, Anwar F, Ashraf M, Saari N, Perveen R. 2013. Ameliorating effects of exogenously applied proline on seed composition, seed oil quality and oil antioxidant activity of maize (Zea mays L.) under drought stress. Int J Mol Sci 14: 818–835. https://doi.org/10.3390/ijms14010818 [CrossRef] [PubMed] [Google Scholar]
- Alizadeh-Yeloojeh K, Saeidi Gh, Sabzalian MR. 2020. Drought stress improves the composition of secondary metabolites in the safflower flower at the expense of a reduction in seed yield and oil content. Ind Crops Prod 154 (112496): 1–10. https://doi.org/10.1016/j.indcrop.2020.112496 [CrossRef] [Google Scholar]
- Amini H, Arzani A, Karami M. 2014. Effect of water deficiency on seed quality and physiological traits of different safflower genotypes. Turk J Biol 38 (2): 271–282. https://doi.org/10.3906/biy-1308-22 [CrossRef] [Google Scholar]
- Arnon DI. 1949. Copper enzymes in isolated chloroplasts, polyphennoloxidase in Beta vulgaris. Plant Physiol 24: 1–150. [CrossRef] [PubMed] [Google Scholar]
- Bates LS, Waldern RP, Teave ID. 1973. Rapid determination of free proline for water stress studies. Plant Soil 39: 205–207. [CrossRef] [Google Scholar]
- Bortolheiro F, Silva M. 2017. Physiological response and productivity of safflower lines under water deficit and rehydration. An Braz Acad Sci 89: 3051–3066. [CrossRef] [PubMed] [Google Scholar]
- Chavoushi M, Najafi F, Salimia A, Angaji A. 2019. Improvement in drought stresses tolerance of safflower during vegetative growth by exogenous application of salicylic acid and sodium nitroprusside. Ind Crop Prod 134: 168–176. https://doi.org/10.1016/j.indcrop.2019.03.071 [CrossRef] [Google Scholar]
- Chavoushi M, Najafi F, Salimi A, Angaji SA. 2020. Effect of salicylic acid and sodium nitroprusside on growth parameters, photosynthetic pigments and secondary metabolites of safflower under drought stress. Sci Hortic 259: 108823. https://doi.org/10.1016/j.scienta.2019.108823 [CrossRef] [Google Scholar]
- Doorenbos J, Pruitt WO (1977) Guidelines for predicting crop water requirements. Irrig. Drain Paper 24 (revised) Food and Agricultural Organization of the United Nations, Rome. [Google Scholar]
- Harsányi E, Bashir B, Alsilibe F, et al. 2021. Impact of agricultural drought on sunflower production across Hungary. Atmosphere 12 (10): 1339. https://doi.org/10.3390/atmos12101339 [CrossRef] [Google Scholar]
- Hosseini SJ, Tahmasebi-Sarvestani Z, Mokhtassi-Bidgoli A, et al. 2023a. Functional quality, antioxidant capacity and essential oil percentage in different mint species affected by salinity stress. Chem Biodivers e202200247. https://doi.org/10.1002/cbdv.202200247 [CrossRef] [PubMed] [Google Scholar]
- Hosseini SJ, Tahmasebi-Sarvestani Z, Mokhtassi-Bidgoli A, et al. 2023b. Do various levels of salinity change chlorophyll fluorescence, nutrient uptake, and physiological characteristics of Mentha ecotypes. Ind Crops Prod 203: 117199. https://doi.org/10.1016/j.indcrop.2023.117199 [CrossRef] [Google Scholar]
- James LG. 1988. Principles of farm irrigation system design, New York: Wiley. [Google Scholar]
- Karami S, Modarres-Sanavy SAM, Ghanehpoor S, Keshavarz H. 2016. Effect of foliar zinc application on yield, physiological traits and seed vigor of two soybean cultivars under water deficit. Not Sci Biol 8 (2): 181–191. https://doi.org/10.15835/nsb.8.2.9793. [CrossRef] [Google Scholar]
- Keshavarz H, Khodabin G. 2019. The role of uniconazole in improving physiological and biochemical attributes of bean (Phaseolus vulgaris L.) subjected to drought stress. J Crop Sci Biotech 22 (2): 161–168. https://doi.org/10.1007/s12892-019-0050-0 [CrossRef] [Google Scholar]
- Keshavarz H, Sadegh Ghol Moghadam R. 2017. Seed priming with cobalamin (vitamin B12) provides significant protection against salinity stress in the common bean. Rhizosphere 3: 143–149. https://doi.org/10.1016/j.rhisph.2017.04.010 [CrossRef] [Google Scholar]
- Keshavarz H. 2020. Study of water deficit conditions and beneficial microbes on the oil quality and agronomic traits of canola (Brassica napus L.). Grasas Y Aceites 71 (3): e373. https://doi.org/10.3989/gya.0572191 [CrossRef] [Google Scholar]
- Keshavarz H, Hosseini SJ, Sedibe MM, Achilonu MC. 2021. Arbuscular mycorrhizal fungi used to support Iranian barley (Hordeum vulgare L.) cultivated on cadmium contaminated soils. Appl Ecol Environ Res 20 (1): 43–53. http://dx.doi.org/10.15666/aeer/2001_043053 [Google Scholar]
- Keshavarz H, Modarres-Sanavy SAM, Mahdipour Afra M. 2018. Organic and chemical fertilizer affected yield and essential oil of two mint species. J Essent Oil-Bear Plants 21 (6): 1674–1681. https://doi.org/10.1080/0972060X 2018.1497545 [CrossRef] [Google Scholar]
- Keshavarz H, Modarres-Sanavy SAM, Sadegh Ghol Moghadam R. 2016. Impact of foliar application with salicylic acid on biochemical characters of canola plants under cold stress condition. Not Sci Bio 8 (1): 98–105. https://doi.org/10.15835/nsb.8.1.9766 [CrossRef] [Google Scholar]
- Keshavarz Mirzamohammadi H, Modarres-Sanavy SAM, Sefidkon F, Mokhtassi-Bidgoli A, Mirjalili MH. 2021a. Irrigation and fertilizer treatments affecting rosmarinic acid accumulation, total phenolic content, antioxidant potential and correlation between them in peppermint (Mentha piperita L.). Irrigation Sci 39: 671–683. https://doi.org/10.1007/s00271-021-00729-z [CrossRef] [Google Scholar]
- Keshavarz Mirzamohammadi H, Tohidi-Moghadam HR, Hosseini SJ. 2021b. Is there any relationship between agronomic traits, soil properties and essential oil profile of peppermint (Mentha piperita L.) treated by fertiliser treatments and irrigation regimes? An Appl Biol 179 (3): 331–344. https://doi.org/10.1111/aab.12707 [CrossRef] [Google Scholar]
- Mahdavi B, Modarres Sanavy SAM, Aghaalikhani M, Sharifi M, Dolatabadian A. 2011. Chitosan improves osmotic potential tolerance in safflower (Carthamus tinctorius L.) seedlings. J Crop Improvement 25 (6): 728–741. https://doi.org/10.1080/15427528.2011.606354 [CrossRef] [Google Scholar]
- Moradi-Ghahderijani M, Jafarian S, Keshavarz H. 2017. Alleviation of water stress effects and improved oil yield in sunflower by application of soil and foliar amendments. Rhizosphere 4: 54–61. http://dx.doi.org/10.1016/j.rhisph.2017.06.002 [CrossRef] [Google Scholar]
- Noleto-Dias C, Picoli EAT, Porzel A, Wessjohann LA, Tavares JF, Farag MA. 2023. Metabolomics characterizes early metabolic changes and markers of tolerant Eucalyptus ssp. clones against drought stress. Phytochemistry 212: 113715. https://doi.org/10.1016/j.phytochem.2023.113715 [CrossRef] [PubMed] [Google Scholar]
- Rah Khosravani AT, Mansourifar C, Modarres-Sanavy SAM, Asilan KS, Keshavarz H. 2017. Effects of sowing date on physiological characteristics, yield and yield components for different maize (Zea mays L.) hybrids. Notulae Sci Bio 9 (1): 143–147. https://doi.org/10.15835/nsb919913. [CrossRef] [Google Scholar]
- SAS Institute Inc. (2002). The SAS system for windows, release 9.0. Cary, NC, USA: Statistical Analysis Systems Institute. [Google Scholar]
- Sabourifard H, Estakhr A, Bagheri M, Hosseini SJ, Keshavarz H. 2023. The quality and quantity response of maize (Zea mays L.) yield to planting date and fertilizers management. Food Chem Adv 2: 100196. https://doi.org/10.1016/j.focha.2022.100196 [CrossRef] [Google Scholar]
- Yousefzadeh S, Keshavarz H, Modares-Sanavy. 2023. Effects of ecological agriculture approaches on dragonhead (Dracocephalum moldavica L.) productivity and oil yield. Arab J Geosci 16: 373. https://doi.org/10.1007/s12517-023- 11461-7 [Google Scholar]
Cite this article as: Seify SM, Madani H, Pourdad SS, Nour-Mohammadi G, Changizi M. 2023. Impact of deficit irrigation on the physiological and agronomic traits of 24 safflower (Carthamus tinctorius L.) genotypes grown in Iran. OCL 30: 27.
All Tables
Combined analysis of variance on some physiological and agronomic traits of safflower (Carthamus tinctorius L.) genotypes.
Mean comparison of interaction effect of irrigation regimes × safflower genotypes on studied traits sliced by irrigation regimes in two years together (2019 and 2020).
Mean comparison of interaction effect of irrigation regimes × safflower genotypes on studied traits sliced by irrigation regimes in two years together (2019 and 2020).
Correlation analysis between different studied traits for the two irrigation regimes in two years together.
All Figures
|
Fig. 1 Average monthly air temperature and precipitation during the period of March–August in 2019 and 2020. |
| In the text | |
|
Fig. 2 The results of dendrogram based on cluster analysis (A) and biplot of first and second components based of principal component analysis in to years together (2019 and 2020). Y1: Total chlorophyll content, Y2: Proline content, Y3: Plant height, Y4: Leaf dry weight, Y5: Number of heads plant−1, Y6: 1000 seed weight, Y7: Seed yield, Y8: Biological yield, Y9: Seed oil content, Y10: Seed oil yield, Y11: Harvest index. G1: 28.11 Arak; G2: 324.s6.697, G3: 32.88 cgl, G4: 34.14.73, G5: 346-s6.687, G6: 3-8-36.60.11, G7: 86-56-58-697, G8: Faraman, G9: irv-55-55, G10: pi 199888, G11: pi 253384, G12: pi 262444, G13: pi 405985, G14: pi 559909 (acstirling), G15: Sina, Snc-1, G16: Syrian, G17: Esfahan 10, G18: Eslamabad 3.14, G19: Hybridization, G20: Darab No.6, G21: Diz 56, G22: Zarghan 279, G23: Maraghe (autumn crop), G24: Ch 353.https://doi.org/10.1016/j.indcrop.2023.117199 |
| In the text | |
|
Fig. 3 Two-way interaction of irrigation regimes and genotypes on seed yield of safflower (Carthamus tinctorius L.) in two years together (2019 and 2020). |
| In the text | |
|
Fig. 4 Two-way interaction of irrigation regimes and genotypes on seed yield of safflower (Carthamus tinctorius L.) in two years together (2019 and 2020). |
| In the text | |
Current usage metrics show cumulative count of Article Views (full-text article views including HTML views, PDF and ePub downloads, according to the available data) and Abstracts Views on Vision4Press platform.
Data correspond to usage on the plateform after 2015. The current usage metrics is available 48-96 hours after online publication and is updated daily on week days.
Initial download of the metrics may take a while.