")
")
| Issue |
OCL
Volume 32, 2025
Non-Food Uses Of Oil- And Protein- Crops / Usages Non Alimentaires des Oléoprotéagineux
|
|
|---|---|---|
| Article Number | 2 | |
| Number of page(s) | 12 | |
| DOI | https://doi.org/10.1051/ocl/2024033 | |
| Published online | 7 janvier 2025 | |
Research Article
Polyvinyl chloride thermal stabilizer from high-acid crude rice bran oil: a non-food utilization of rice bran oil☆
Stabilisateur thermique du chlorure de polyvinyle (PVC) à partir d’huile brute de son de riz à haute acidité : une utilisation non alimentaire de l’huile de son de riz
1
Research Group on Sustainable Chemical Engineering Product, Faculty of Industrial Technology, Institut Teknologi Bandung, Jalan Ganesha 10, Bandung 40132, Indonesia
2
Master Program in Chemical Engineering, Faculty of Industrial Technology, Institut Teknologi Bandung, Jalan Ganesha 10, Bandung 40132, Indonesia
* Corresponding author: Cette adresse e-mail est protégée contre les robots spammeurs. Vous devez activer le JavaScript pour la visualiser.
Received:
11
July
2024
Accepted:
27
November
2024
Abstract
Rice bran is a source of healthy oil which contains antioxidants and essential vitamins. Without pretreatment, the rapid activity of lipase enzyme causes the oil to contain high amounts of free fatty acids, making it unsuitable for edible purposes. In such cases, utilizing it for chemicals becomes an option. This study presents the synthesis of reverse ester organotin (REOT) as a thermal stabilizer for polyvinyl chloride (PVC) from high-acid crude rice bran oil. The success of the synthesis was confirmed through FTIR spectroscopy. The stabilizing effect of the resulting REOT was examined through dehydrochlorination and two-roll mill tests. Both tests confirmed that the obtained REOT could significantly increase the thermal stability of PVC. At relatively low dosages of 0.5 to 1.5 phr (parts per hundred resin), it maintained the initial color of PVC for up to 45–60 min when rolled under heating at 190 °C. Additionally, its thermal stabilizing effects were comparable to REOT derived from tall oil fatty acid (TOFA), a conventional raw material. The impact on flowability of PVC melt was also statistically similar to that of REOT from TOFA. Overall, crude rice bran oil fatty acid has been proven to be an effective alternative raw material for REOT based PVC thermal stabilizer.
Résumé
Résumé
Le son de riz est une source d’huile bénéfique pour la santé qui contient des antioxydants et des vitamines essentielles. Sans prétraitement, l’activité rapide de la lipase génère de fortes concentrations d’acides gras libres dans l’huile, la rendant inadaptée à des utilisations alimentaires. Dans de tels cas, son utilisation pour la fabrication de produits chimiques devient une option. Cette étude présente la synthèse d’ester inverse d’organostannique (REOT) comme stabilisateur thermique pour le chlorure de polyvinyle (PVC) à partir d’huile brute de son de riz à haute acidité. Le succès de la synthèse a été confirmé par spectroscopie FTIR. L’effet stabilisant du REOT obtenu a été examiné par des tests de déshydrochlorination et de laminoir à deux rouleaux. Les deux tests ont confirmé que le REOT obtenu pouvait augmenter de manière significative la stabilité thermique du PVC. À des dosages relativement faibles de 0,5 à 1,5 phr (parts per hundred resin), il a permis de maintenir la couleur initiale du PVC pendant 45 à 60 minutes lorsqu'il était laminé sous chauffage à 190°C. De plus, ses effets stabilisants thermiques étaient comparables à ceux du REOT dérivé d’acide gras d’huile de colza (TOFA), une matière première conventionnelle. L’impact sur la fluidité du PVC en fusion était également statistiquement similaire à celui du REOT de colza. Globalement, les acides gras de l’huile brute de son de riz se sont révélés être une matière première alternative efficace pour une stabilisation thermique du PVC à base de REOT.
Key words: Free fatty acid / heat stabilizer / polyvinyl chloride / reverse ester organotin / rice bran oil
Mots clés : Acides gras libres / Stabilisateur thermique / PVC / organostannique / Huile de son de riz
Contribution to the Topical Issue: “Non-Food Uses Of Oil- And Protein- Crops / Usages Non Alimentaires des Oléoprotéagineux”.
© I Dewa Gede Arsa Putrawan et al., Published by EDP Sciences, 2025
 This is an Open Access article distributed under the terms of the Creative Commons Attribution License (https://creativecommons.org/licenses/by/4.0), which permits unrestricted use, distribution, and reproduction in any medium, provided the original work is properly cited.
Highlights
Reverse ester organotin has been successfully synthesized from high-acid crude rice bran oil.
Polyvinyl chloride can be effectively stabilized against heat by reverse ester organotin derived from rice bran fatty acid.
High-acid crude rice bran oil serves as an effective raw material for producing polyvinyl chloride thermal stabilizers.
1 Introduction
Crude rice bran oil is obtained by solvent extraction from rice bran (Mas’ud et al., 2019). Rice bran, a byproduct of rice mills, typically contains 18–22% oil, predominantly oleic and linoleic acids, alongside essential vitamins and antioxidants like oryzanol, making it a healthful vegetable oil variant (Punia et al., 2021). Despite its nutritional benefits, rice bran oil is prone to rancidity due to the enzymatic activity of lipase (Yılmaz Tuncel, 2023). The lipase enzyme rapidly hydrolyzes rice bran oil into fatty acids due to the large surface area of the fine rice bran particles, facilitating swift hydrolysis. This leads to a high free fatty acid content in the crude ride bran oil. Without intervention, storage for merely 2-3 days renders rice bran oil purification economically unfeasible (Cheight and Kim, 1984). It is due to the excessive oil lost during the neutralization process.
The aforementioned issue can be solved either by promptly extracting rice bran after milling or by stabilizing it to deactivate lipase (Duangsi and Krongyut, 2023). However, in regions like Indonesia, where 95% of rice mills are small-scale, not run every day, sporadically operated, and scattered across various locations (Rafei, 2021), challenges arise. Extracting fresh rice bran is hindered by insufficient capacity, while stabilization incurs prohibitive costs. As a result, the inevitable occurrence of rice bran rancidity before extraction presents significant obstacles to its use in edible oil production. In such circumstances, another viable option is to utilize it for chemical synthesis.
Reverse ester organotin (REOT) is a popularly used thermal stabilizer for polyvinyl chloride particularly for rigid applications and is an alternative to lead-based thermal stabilizers which are not environmentally friendly (Schiller, 2015). It is synthesized from fatty acid, mercaptoalcohol, and alkyltin chloride. The term ‘reverse esters’ is used because they are derived from mercaptoalcohol and carboxylic acid instead of alcohol and thiocarboxylic acid (Beekman and Price, 1998).
High acid crude rice bran oil, which is not feasible for edible purposes, has potential as a raw material for REOT. An important question is whether the resulting stabilizing effect is effective and can compete with REOT obtained from conventional raw materials. To date, no studies have been conducted on this subject. This research aimed to synthesize REOT using fatty acids derived from crude rice bran oil which was extracted from rancid rice bran and to evaluate its thermal stabilizing effects on PVC resin. Tall oil fatty acid (TOFA), which is generally utilized as raw material to produce REOT, was used as comparison.
2 Materials and methods
2.1 Materials
Rice bran, aged approximately one week after milling, was sourced from a local rice mill. Potassium hydroxide (≥99.9 wt%), hydrochloric acid solution (37 wt%), Wijs solution (0.1 mol ICl/L), sublimated iodine (≥99.8 wt%), n-hexane (≥95 wt%), 2-merkaptoetanol (≥99.0 wt%), and p-toluene sulfonic acid (≥98 wt%), were procured from Sigma-Aldrich. Ammonia solution (25 wt%) and cyclohexane (≥99.5 wt%) were purchased from Smart-Lab. Methyltin chloride solution consisting of methyltin trichloride (CH3SnCl3), dimethyltin dichloride ((CH3)2SnCl2), and water, was kindly supplied by a local company (Timah Industri). The content of chloride, tin, and water in the solution was 17.4%, 26.5%, and 50%, by weight, respectively. The ratio of (CH3)2SnCl2 to CH3SnCl3 was 3.8, by weight. PVC resin (AGC Vinythai) having a k-value of 65–66 was used for thermal stability test. Additives used to facilitate two-roll mill and melt flow index tests were of industrial grade and purchased from a local supplier (Resikel Global Techindo). They included calcium stearate (white powder, 99 wt%), stearic acid (white powder, 99 wt%), polyethylene wax (white flake, 1500–2000 g/mol molecular wight), chlorinated polyethylene (white flake, 35 wt% of chlorine), polyacrylate (white powder, 99 wt%), and calcium carbonate (white powder, 98 wt%).
2.2 Preparation of fatty acid
Rice bran oil was extracted using n-hexane in a Soxhlet extractor (250 ml volume of extraction chamber). The solvent was removed by vacuum evaporation to obtain crude rice bran oil. Extraction was carried out several times to obtain enough rice bran oil.
Approximately 250 g of the resulting oil was mixed with 500 ml of potassium hydroxide solution (2.65 mol/L) in aqueous ethanol with an ethanol to water ratio of 2 by volume. An excess of 50% potassium hydroxide, based on the stoichiometric requirement determined from the saponification number, was used. The mixture was refluxed in 4 hours and then cooled. The formed potassium soap was acidified using a concentrated hydrochloric solution (33.3 wt%). The liberated fatty acid, hereafter referred to as rice bran fatty acid (RBFA), was washed three times using warm distilled water and dried under vacuum.
2.3 Synthesis
REOT was synthesized in two steps. Initially, reverse ester (RCOOCH2CH2SH) was made from the prepared fatty acid (RCOOH) and 2-mercaptoethanol, following reaction (1). Fatty acid (60 g) and 2-mercaptoethanol (1.1 mol/mol of fatty acid) were reacted for 6 hours in a Dean-Stark apparatus (a flask volume of 500 mL) at a reflux temperature (80 °C), with p-toluenesulfonic acid (0.02 mol/mol of fatty acid) as a catalyst and cyclohexane (250 ml) as a solvent. The Dean-Stark condenser facilitated water removal by extractive vaporization, shifting the reaction toward the product. After cooling, the reaction mixture was washed three times with distilled water and then vacuum-evaporated to remove the solvent and recover the formed reverse ester.
Subsequently, the resulting reverse ester was used to synthesize REOT, following reactions (2) and (3). Reverse ester (50 g) was dissolved in n-hexane (100 ml), mixed with methyltin chloride solution at room temperature in a glass beaker (250 mL), and agitated with a magnetic stirrer. Ammonia solution was then added dropwise using a peristaltic pump while mixing. Ammonia assisted the reaction between immiscible reverse ester and methyltin chloride solution while neutralizing the formed hydrochloric acid, following reaction (4). The mixture was allowed to react for one hour, following which the resulting hexane phase was washed three times with distilled water and dried under vacuum to obtain REOT. The amount of methyltin chloride solution was calculated based on the thiol (SH) quantity in the reverse ester, as described in reactions (2) and (3). The required amount of ammonia solution was also based on the thiol quantity, plus a small amount needed to neutralize the remaining free fatty acids in the reverse ester.
 (1)
(1)
 (2)
(2)
 (3)
(3)
 (4)
(4)
2.4 Analysis
Acid number was measured by acid-base titration (ASTM procedure number D5555-95-2023). Saponification number was determined by refluxing a sample with excessive potassium hydroxide solution and titrate the excess of potassium hydroxide with hydrochloric acid solution (ASTM procedure number D5558-95-2023). Iodine number was quantified by Wijs method (ASTM procedure number D5554-15-2021). Thiol content was determined by iodine titration (Jeffery et al., 1989). Tin content was measured using an energy dispersive X-ray fluorescence (EDXRF) spectrometer (NEXCG model of Applied Rigaku Technologies, USA). All analyses were done with triplicate samples.
Fatty acids were analyzed in the forms of methyl ester using a GCMS (Shimadzu, QP2010 Ultra model) with an RtX®-5MS capillary column (30 m length, 0.25 mm ID, and 0.25µm film thickness) and helium gas as a carrier. The analysis was carried out in duplicate. The temperature was increased from 50 to 250 oC at 4 oC/min. Injector and detector temperatures were set at 280 oC. Split injection was conducted with a split ratio of 100:1, the flow rate was 1.1 mL/min, and the injection volume was 1 µL. Ionization energy EI of 70 eV was applied for the mass spectroscopy detector with a source temperature at 200 oC, interface temperature at 250 oC, and scan range of 50–500 amu. Methyl esters were made by esterifying the sample using methanol in the presence of boron trifluoride catalyst (ASTM procedure number D2800–92-1998).
2.5 Characterization
The presence of characteristic functional groups was analyzed by the Fourier Transform Infrared (FTIR) spectroscopy (Shimadzu, Prestige-21 model). The spectra were acquired in the 400–4000 cm–1 wave number range with a resolution of 2 cm–1 and 50 scans. The FTIR measurement was performed in transmission mode.
2.6 Thermal stability test
Dehydrochlorination tests were performed in accordance with ISO 182-3 guidelines, utilizing 1 gram of PVC resin with thermal stabilizer at a dosage of 0.25–1.0 phr (parts per hundred resin). The tests were carried out at 180 °C with triplicate samples. The hydrogen chloride gas evolved during the tests was absorbed into 200 ml of distilled water and the conductivity of water was measured using a conductivity meter. The induction and stability times were recorded upon observing increments of 3 and 50 µS/cm in the conductivity of water, respectively.
The samples for the dehydrochlorination tests were each prepared using 10 grams of PVC resin. Since only a small amount of REOT was needed, the preparation began by dissolving the REOT in 10 ml of n-hexane in a 50 ml beaker. The resin was then added to the solution, and the mixture was agitated with a glass rod while being warmed from the outside with a hair dryer to evaporate the solvent, leaving the resin covered with REOT.
Discoloration tests (dynamic tests) were conducted by heating and rolling the resin containing REOT. Other additives, added into the resin to facilitate the test, were calcium stearate, stearic acid, polyethylene wax, chlorinated polyethylene, polyacrylate, and calcium carbonate. Calcium stearate and stearic acid work as internal lubricants, while the others serve as external lubricant, processing aid, impact modifier, and filler, respectively. The applied dosages for these additives were 0.4, 0.4, 0.6, 4.0, 1.0, and 15.0 phr, respectively. The tests were carried out using a two-roll mill (Zongli ZL3018 model), at 190 °C and 11 rpm, with a roll gap of 0.25 mm. The REOT dosage varied within the 0.5–1.5 phr range. Before rolling, the mixture of resin, REOT, and other additives was blended using a handheld blender (Philips HR 1603) for 5 min.
2.7 Yellowness index measurement
The Yellowness index was determined using a colorimeter (DS-200 model by Hinotek Instrument). The measurements were conducted on specimens resulting from the roll mill test that had not yet turned dark or black, at 9 randomly selected locations per specimen.
2.8 Melt flow index determination
A melt flow index tester (Guangdong Liyi Technology LY-RR model) was used to measure the flow index of PVC melt stabilized by REOT, with additional additives included as in the two-roll mill test. The measurements were carried out in quadruplicate, at 190 °C and using a load of 21.6 kg, in accordance with ASTM D1238 procedure.
3 Results
Table 1 presents the measured acid, saponification, and iodine numbers of RBFA and TOFA, accompanied by their main fatty acid contents (as methyl esters) in Table 2 and their FTIR spectra in Figure 1. The wave numbers of major peaks are presented in Table 3. The analytical results of the synthesized reverse esters and REOTs, from both RBFA and TOFA, are presented in Tables 4 and 5, respectively. The FTIR spectra of reverse ester and REOT, including those of their reactants, are depicted in Figures 2 and 3, respectively. The images of reverse esters and REOTs along with their corresponding fatty acids are shown in Figure 4. The results of stability tests included dehydrochlorination curves, induction and stability times, and discolored PVC resins processed on a two-roll mill. Figure 5 shows typical dehydrochlorination curves observed at various dosages of REOT. The induction and stability times, obtained from triplicate dehydrochlorination tests, are presented in Figure 6. Table 6 provides the results of two-roll mill tests of PVC resins stabilized by REOT. Figure 7 presents the observed Yellowness index of the two-roll mill specimens measured at 9 surface locations. Figure 8 presents the melt flow index of PVC resins stabilized by REOTs, based on 4 measurements. All deviations, whether presented as confidence intervals or as error bars, were calculated at the 95% confidence level (Montgomery et al., 2011).
Characteristics of fatty acids.
Fatty acid composition.
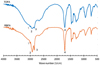 |
Fig. 1 FTIR spectra of RBFA and TOFA. |
Assignment of FTIR spectra.
Characteristics of reverse esters.
Characteristics of REOTs.
 |
Fig. 2 FTIR spectra of reverse esters and their reactants. |
 |
Fig. 3 FTIR spectra of REOTs and their reactants. |
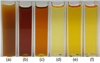 |
Fig. 4 Images of RBA (a), reverse ester from RBA (b), REOT from RBFA (c), TOFA (d), reverse ester from TOFA (e), and REOT from TOFA (f). |
 |
Fig. 5 Dehydrochlorination curves of PVC resin stabilized by REOTs from RBFA (a) and TOFA (b) (dosage in phr). |
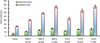 |
Fig. 6 Induction and stability times of PVC resin stabilized by REOTs from RBFA and TOFA (dosage in phr). |
Discoloration of PVC resin stabilized by REOTs from RBFA and TOFA.
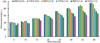 |
Fig. 7 Yellowness index of two-roll mill specimens with REOT dosages (phr) shown in parentheses. |
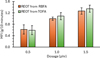 |
Fig. 8 Melt flow index of PVC resin stabilized by REOT. |
4 Discussion
4.1 Characteristics of fatty acid
The extraction of rice bran, aged 7 days after leaving the milling machine, yielded 17% by weight of oil with an acid number of 75.7 ± 1.3 mg KOH/g, indicating rapid enzymatic hydrolysis. The free fatty acid content reached 38.2% by weight as oleic acid. According to Chakrabarti (2019), rice bran oil containing more than 10% free fatty acid is unsuitable for human consumption, and rice bran oil with more than 5% free fatty acid is not feasible for refining by chemical method due to significant refining loss.
The rice bran oil obtained was saponified and acidified to produce RBFA. Table 1 compares the characteristics of RBFA with TOFA. Compared to the initial crude rice bran oil, the acid number of RBFA was much higher and was close to its saponification number, confirming that most of the remaining neutral oil was hydrolyzed into free fatty acid. The acid and saponification numbers of RBFA were lower than those of TOFA, which was expected since TOFA is a refined product, whereas RBFA, in this study, was not subjected to purification. In addition, the iodine number of RBFA was lower than that of TOFA, likely due to differences in composition. Composition analysis showed that TOFA was almost entirely of unsaturated fatty acids, mainly oleic and linoleic, while the unsaturated fatty acids in RBFA was 75.6 wt% (Tab. 2).
FTIR spectra of both RBFA and TOFA (Fig. 1, Table 3) display a broad and intense band at 3600–2800 cm−1, indicating the presence of O‒H stretching. Other characteristic peaks include the double bonds (=CH) of unsaturated fatty acids, the asymmetric stretching vibration of CH2 (asym -CH2), the symmetric stretching vibration of CH2 (sym -CH2), and the stretching vibration of acidic carbonyl (-C=O) (Azmi et al., 2022). In the RBFA spectrum, these peaks appear at 3007, 2924, 2853, and 1711 cm−1, respectively. In the TOFA spectrum, they appear at 3007, 2924, 2855, and 1709 cm−1, respectively. The stretching band of ester carbonyl functional group of triglycerides, which is usually appear at around 1746 cm−1 (Vlachos et al., 2006), is not observed, indicating a small quantity of neutral oils in both fatty acids.
The presence of neutral oil is indicated by the ester number, which is calculated as the difference between the saponification number and the acid number. The small amount of neutral oil in the obtained RBFA is evident from the proximity of the acid number to the saponification number. According to the data in Table 1, the ester number of RBFA is only 12.5 mg KOH/g. This presence of neutral oil, especially in small amounts, does not significantly interfere with the process because it does not participate in the synthesis reactions, including either reverse ester or REOT synthesis.
4.2 Characteristics of reverse ester
Figure 2 presents the spectra of reverse esters from RBFA (a) and TOFA (b) along with 2-mercaptoethanol and their respective fatty acid spectrum. The major peaks are detailed in Table 3. In addition to the asymmetric and symmetric -CH2 bands appearing at 2934 and 2874 cm–1, the FTIR spectrum of 2-mercaptoethanol is characterized by the stretching vibration of hydroxyl (-OH) and thiol (-SH), observed at 3372 and 2556 cm–1, respectively. As seen in the figure, the spectra of reverse esters from RBFA and TOFA contain peaks for thiol and ester carbonyl groups at 2571 and 1740 cm–1, respectively. These functional groups originate from 2-mercaptoethanol and associated fatty acid, respectively. The observed spectra confirmed that the synthesis of reverse esters from RBFA and TOFA were successful.
The fatty acid composition (Tab. 2) provides the estimated average molecular weights of 276 and 281 g/mole for fatty acids in RBFA and TOFA, respectively. These values correspond to theoretical thiol contents of 9.8% and 9.7% for reverse esters from RBFA and TOFA, respectively. Similarity in these values is expected, given the small difference in average molecular weights between RBFA and TOFA.
Table 4 presents the characteristics of reverse esters from RBFA and TOFA. Compared to their origin fatty acids, the acid numbers of reverse esters were greatly reduced. Not all free fatty acids could be converted; however, the remaining free fatty acids were not significant. Relative to the acid numbers of their respective fatty acids, the remaining free fatty acids in the reverse ester products from RBFA and TOFA were 12% and 10%, respectively.
The measured thiol contents of both reverse esters from RBFA and TOFA were quite close. The values, however, were only 74% to 75% of their theoretical values, respectively. This discrepancy is due to side reactions. Carboxyl and thiol can react to form thioester (Sonnet and Moore, 1989). Unsaturated bound can also react with thiol to form thiolene (Samuelsson et al., 2004). The presence of unconverted free fatty acid and neutral oil had contribution in reducing purity too.
4.3 Characteristics of REOT
The FTIR spectra of REOTs from RBFA and TOFA along with their corresponding reverse esters and dimethyl tin chloride solution are depicted in Figure 3 with major peaks presented in Table 3. The spectrum of the dimethyltin chloride solution contains the O−H stretching and H−O−H bending bands at 3418 and 1630 cm–1, respectively. This indicates the presence of water (Artemov et al., 2020). The used methyltin chloride solution contained 50% water. The Sn-C bound was observed at 808 cm–1. The spectra of REOTs are practically similar to those of their corresponding reverse esters, except for the presence of the Sn-C band at 763 cm–1.
As shown in Table 5, the sulfur and tin contents of REOT from RBFA were slightly lower than those of REOT from TOFA. This is due to the purity of the reverse ester from RBFA being slightly lower than that of the reverse ester from TOFA, which is also indicated by its slightly lower thiol content. The thiol content determines the amount of organotin that can be bound.
The REOTs obtained consisted of methyl tin tris(mercaptoethyl carboxylate) and dimethyl tin bis(mercaptoethyl carboxylate) having formulas of CH3Sn(SCH2CH2OOCR)3 and (CH3)2Sn(SCH2CH2OOCR)2, respectively, since the alkyltin chloride used consisted of monomethyltin trichloride and dimethyltin dichloride. With a dimethyltin dichloride-to-methyltin trichloride weigh ratio of 3.8 and the previously estimated average molecular weights for the fatty acids used, without impurities, the resulting REOT from RBFA should contain 7.9% of sulfur and 13.7% of tin by weight and the resulting REOT from TOFA should contain 7.8% of sulfur and 13.5% of tin by weight. As appeared in Table 5, the sulfur and tin contents of REOT from RBFA were 76% and 78%, respectively, of their theoretical values. On the other hand, the sulfur and tin contents of REOT from TOFA were 78% and 81%, respectively, of their theoretical values. Based on this, the REOTs from RBFA and TOFA were estimated to have purities of 76-78% and 78-81%, respectively. The purities did not reach 100% because reverse esters used as raw materials for REOTs were also not pure. All oil components in the reverse ester, such as neutral oil and side products, will be included in the final product (REOT) because REOT is oil in nature.
4.4 Appearance of reverse ester and REOT
Figure 4 displays the images of reverse esters and REOTs along with their origin fatty acids. Both REOTs from RBFA and TOFA were liquid at room temperature and slightly heavier than water. In contrast, their respective reverse esters were slightly lighter than water. The presence of tin in REOT makes its density heavier than its corresponding reverse ester. The colors of reverse esters and REOT from RBFA, however, were quite different from those of TOFA. Both reverse ester and REOT from RBFA appeared darker. The color difference originated from the raw materials; RBFA was dark while TOFA was a golden yellow color. The dark color in RBFA is due to the decomposition of chlorophylls into pheophytins and the extraction of pigments and impurities (Junyusen et al., 2022).
4.5 Thermal stabilization effect
The measured dehydrochlorination curves of PVC resins stabilized by REOT either from RBFA or TOFA (Fig. 5) show a typical trend as observed by Thomas (2024): initially, the conductivity remains unchanged. After a definite time, as hydrogen chloride begins to form, the conductivity increases slightly and continues to rise at a moderate rate. Finally, the curve climbs sharply when the efficacy of the thermal stabilizer cannot overwhelm the degradation.
Figure 6 summarizes the induction and stability times determined from the dehydrochlorination curves corresponding to the moments when the PVC resin starts degrading and severely degraded, respectively. Without a thermal stabilizer, the PVC resin evolved hydrogen chloride shortly after being heated, as indicated by the low induction time. The degradation rate was also high, as shown by the steep dehydrochlorination curve soon after passing the induction time. The stabilizing effects of REOT from RBFA effectively compete with that from TOFA. At a fairly low dosage, 0.25–1.0 phr, REOTs from RBFA and TOFA were able to delay the liberation of hydrogen chloride from PVC resin in 5–14 minutes and extend the stability of PVC resin by 16-51 minutes. This indicates that the REOTs from both fatty acids were equally effective. This similarity in effectiveness is due to the comparable sulfur and tin levels in the two REOTs.
Sulfur and tin are crucial elements in the stabilization mechanism of REOT. REOT can exchange its sulfur containing ligand, reverse ester, with labile allylic chloride in the PVC structure (reaction I, Fig. 9a) (Arkış and Balköse, 2005). Additionally, it can bind the hydrogen chloride released from the PVC structure, preventing its destructive effect as an auto catalyst for further degradation (reaction II, Fig. 9b) (Arkış and Balköse, 2005).
After participating in the stabilization reaction, REOT essentially reverts to methyltin chloride and reverse ester. Methyltin chloride does not have a destabilizing effect (Wirth and Andreas, 1977), unlike zinc chloride, the stabilization product of the zinc/calcium stearate system, which catalyzes dehydrochlorination, resulting in a zinc burning effect (Wu et al., 2018). Reverse ester, on the other hand, has a stabilizing effect. It can substitute labile chloride in the PVC resin (reaction III, Fig. 9c) and reduce the length of the polyene chain (reaction IV, Fig. 9d) (Starnes et al., 2006), a structure formed due to dehydrochlorination. Reaction IV reduces discoloration because the shorter the polyene chain, the lighter the color of the resin. Reaction III, although it produces hydrogen chloride, still has a positive effect because it prevents the subsequent formation of allylic chloride. The ability of the stabilization product to stabilize PVC resin is indicated by the lower slope of the dehydrochlorination curve with increasing dosage (Wirth and Andreas, 1977).
Table 6 presents the results of two-roll mill test at 190 °C on PVC resins stabilized by REOT synthesized from RBFA at various dosages, along with other additives formulated in subsection 2.6. Results using PVC resin without thermal stabilizer and with REOT from TOFA as a thermal stabilizer are also included for comparison. Without a thermal stabilizer, the PVC resin blackened in less than 5 minutes. At dosages of 0.5–1.5 phr, REOT from RBFA enabled the PVC resin to maintain its initial color and slow down blackening (increase long-term stability). Both initial color stability and long-term stability improved with increasing dosage, which is consistent with the results of the dehydrochlorination test.
At the same dosage, the color stability provided by REOT from RBFA, however, is slightly inferior to that provided by REOT from TOFA. This is more clearly seen in the Yellowness index measurements of the roll-mil test specimens (Fig. 7). REOT from RBFA provided a higher Yellowness index at the same dosage at most heating times. REOT from RBFA produced a slightly darker film, likely due to impurities in RBFA that degraded during heating. Despite weaker initial color stability, REOT from RBFA showed long-term stability comparable to REOT from TOFA. At a dosage of 0.5%, the PVC resins stabilized by REOT from either RBFA or TOFA did not turn black up to 45 minutes of heating. At a dosage between 1.0 to 1.5 phr, the PVC resins stabilized by REOT either from RBFA or TOFA were not blackened for up to 60 minutes. Consistent with the results of dehydrochlorination tests, the two-roll mill tests also demonstrated that REOT from RBFA was as effective as REOT from TOFA.
 |
Fig. 9 Stabilization reactions: I (a), II (b), III (c), and IV (d). |
4.6 Melt flow index
Melt flow index is widely used in practice to characterize the processability of polymer materials and select a processing method (Vikhareva et al., 2021). It indicates the flowability of PVC resin melt. Figure 8 depicts the melt flow indexes of PVC resins stabilized by REOTs from RBFA and TOFA using the roll-mill formulation outlined in Section 4.5. Overall, the observed melt flow index was relatively low. This is attributed by the anti-plasticization effect of sulfur-containing thermal stabilizer (Younan et al., 1983).
PVC resins stabilized by REOTs from either RBFA or TOFA exhibited higher flowability with increasing thermal stabilizer dosage. As shown by the stability test data, the thermal stability of PVC resin increased with higher REOT dosages. More thermally stable PVC resin maintained their mechanical and flow properties better, resulting in easier flow and increasing melt flow index. It could also be observed from Figure 8 that the difference in melt flow index of PVC resins stabilized by REOTs from RBFA and from TOFA were not statistically significant. Stabilizing PVC resin using REOT from RBFA, therefore, results in the same processability characters as that stabilized using REOT from TOFA.
5 Conclusions
Reverse ester organotin (REOT), synthesized from fatty acid derived by hydrolyzing crude rice bran oil extracted from rancid rice bran, has been successfully developed to stabilize PVC resins against heat. The resulting REOT contained sulfur and tin at 6.0 ± 0.3 wt% and 10.6 ± 0.2 wt%, respectively. Its effectiveness in stabilizing PVC resin was examined through dehydrochlorination and two-roll mill tests. Both tests demonstrated that REOT from crude rice bran oil fatty acid could significantly increase the thermal stability of PVC resin. At relatively low dosages of 0.5 to 1.5 phr, it maintained the initial color of PVC for up to 45-60 minutes when rolled under heating at 190°C. Additionally, its thermal stabilizing effects were comparable to REOT derived from TOFA, a conventional raw material. The impact on the flowability of PVC resin melt was also statistically similar to that of REOT from TOFA. Crude rice bran oil fatty acid has proven to be an effective alternative raw material for producing REOT as a PVC thermal stabilizer. This work provided an alternative use for rice bran oil, particularly for those that are not suitable for food processing.
Acknowledgments
The authors would like to express their gratitude to Timah Industri Company (Indonesia) for supplying the methyltin chloride solution. The research conducted in this study was not preregistered in an independent, institutional registry.
Funding
This work was supported by Institut Teknologi Bandung under PPMI Program.
Conflicts of interest
The authors declare no conflict of interest.
Data availability statement
All data is contained within the article.
Author contribution statement
I Dewa Gede Arsa Putrawan: conceptualization, data curation, funding acquisition, methodology, project administration, resources, supervision, validation, writing-original draft, writing-review & editing. Novia Rahmawati: formal analysis, investigation, visualization, writing-original draft. All authors contributed to the article and approved the submitted version.
References
- Arkış E, Balköse D. 2005. Thermal stabilization of poly(vinyl chloride) by organotin compounds. Polym Degrad Stab 88: 46–51. [CrossRef] [Google Scholar]
- Artemov VG, Uykur E, Roh S, Pronin AV, Ouerdane H, Dressel M. 2020. Revealing excess protons in the infrared spectrum of liquid water. Sci Rep 10: 11320. [CrossRef] [PubMed] [Google Scholar]
- Azmi IS, Jalil MJ, Hadi A. 2022. Epoxidation of unsaturated fatty acid–based palm oil via peracid mechanism as an intermediate product. Biomass Convers Biorefinery 14: 7847–7855. [Google Scholar]
- Beekman GF, Price LR, 1998. Improved PVC foam compositions. Eur Pat 19970310278. [Google Scholar]
- Chakrabarti PP, Jala RCR. 2019. Processing technology of rice bran oil. Rice Bran Rice Bran Oil: 55–95. [Google Scholar]
- Cheight HS, Kim CJ, 1984. Development and use of a low-cost extruder for the rice-oil stabilization. Korean J Food Sci Technol 16: 37–40. [Google Scholar]
- Duangsi R, Krongyut W. 2023. Stabilization of rice bran by infrared radiation heating for increased resilience and quality of rice bran oil production. Prev Nutr Food Sci 28: 189–199. [CrossRef] [PubMed] [Google Scholar]
- Jeffery GH, Basset J, Mendham J, Denney RC, 1989. Vogels textbook of quantitative chemical analysis. New York: John Wiley & Sons. [Google Scholar]
- Junyusen T, Chatchavanthatri N, Liplap P, Junyusen P, Phan VM, Nawong S. 2022. Effects of extraction processes on the oxidative stability, bioactive phytochemicals, and antioxidant activity of crude rice bran oil. Foods 11: 1143. [CrossRef] [PubMed] [Google Scholar]
- Mas’ud F, Fajar, Bangngalino H, Indriati S, Todingbua A, Suhardi, Sayuti M. 2019. Model development to enhance the solvent extraction of rice bran oil. OCL 26: 16. [CrossRef] [EDP Sciences] [Google Scholar]
- Montgomery DC, Runger GC, Hubele NF, 2011. Engineering statistics. New York: Wiley. [Google Scholar]
- Punia S, Kumar M, Siroha AK, Purewal SS, 2021. Rice bran oil: emerging trends in extraction, health benefit, and its industrial application. Rice Sci 28: 217–232. [CrossRef] [Google Scholar]
- Rafei YD, 2021. Rice milling industry business/company data 2020. Jakarta: Indonesian Central Bureau of Statistics. [Google Scholar]
- Samuelsson J, Jonsson M, Brinck T, Johansson M. 2004. Thiol-ene coupling reaction of fatty acid monomers. J Polym Sci Part Polym Chem 42: 6346–6352. [CrossRef] [Google Scholar]
- Schiller M. 2015. PVC additives: performance, chemistry, development, and sustainability. Munich: Carl Hanser Verlag. [CrossRef] [Google Scholar]
- Sonnet PE, Moore GG, 1989. Thiol esters of 2-mercaptoethanol and 3-mercapto-1,2-propanediol. Lipids 24: 743–745. [CrossRef] [Google Scholar]
- Starnes WH, Du B, Kim S, Zaikov VG, Ge X, Culyba EK, 2006. Thermal stabilization and plasticization of poly(vinyl chloride) by ester thiols: update and current status. Thermochim Acta 442: 78–80. [CrossRef] [Google Scholar]
- Thomas SP, 2024. Polyvinyl chloride (PVC)/Halloysite (HNT) nanocomposites: Thermal stability and structural characterization studies. J King Saud Univ - Eng Sci 36: 98–104. [Google Scholar]
- Vikhareva IN, Aminova GK, Mazitova AK, 2021. Study of the rheological properties of PVC composites plasticized with butoxyethyl adipates. ChemEngineering 5: 85. [CrossRef] [Google Scholar]
- Vlachos N, Skopelitis Y, Psaroudaki M, Konstantinidou V, Chatzilazarou A, Tegou E. 2006. Applications of Fourier transform-infrared spectroscopy to edible oils. Anal Chim Acta 573–574: 459–465. [CrossRef] [PubMed] [Google Scholar]
- Wirth HO, Andreas H. 1977. The stabilization of PVC against heat and light. Pure Appl Chem 49: 627–648. [CrossRef] [Google Scholar]
- Wu B, Wang Y, Chen S, Wang M, Ma M, Shi Y, Wang X. 2018. Stability, mechanism and unique “zinc burning” inhibition synergistic effect of zinc dehydroacetate as thermal stabilizer for poly(vinyl chloride). Polym Degrad Stab 152: 228–234. [CrossRef] [Google Scholar]
- Yılmaz N. 2023. Stabilization of rice bran: a review. Foods 12: 1924. [CrossRef] [PubMed] [Google Scholar]
- Younan MYA, El‐Rifai MA, Mohsen R, El‐Hennawi IM, 1983. Effect of stabilizer type on the mechanical properties of rigid poly(vinyl chloride). I. J Appl Polym Sci 28: 3247–3253. [CrossRef] [Google Scholar]
Cite this article as:I Dewa Gede Arsa Putrawan & Novia Rahmawati,. 2025. Polyvinyl chloride thermal stabilizer from high-acid crude rice bran oil: a non-food utilization of rice bran oil. OCL 32: 2
All Tables
All Figures
|
Fig. 1 FTIR spectra of RBFA and TOFA. |
| In the text | |
|
Fig. 2 FTIR spectra of reverse esters and their reactants. |
| In the text | |
|
Fig. 3 FTIR spectra of REOTs and their reactants. |
| In the text | |
|
Fig. 4 Images of RBA (a), reverse ester from RBA (b), REOT from RBFA (c), TOFA (d), reverse ester from TOFA (e), and REOT from TOFA (f). |
| In the text | |
|
Fig. 5 Dehydrochlorination curves of PVC resin stabilized by REOTs from RBFA (a) and TOFA (b) (dosage in phr). |
| In the text | |
|
Fig. 6 Induction and stability times of PVC resin stabilized by REOTs from RBFA and TOFA (dosage in phr). |
| In the text | |
|
Fig. 7 Yellowness index of two-roll mill specimens with REOT dosages (phr) shown in parentheses. |
| In the text | |
|
Fig. 8 Melt flow index of PVC resin stabilized by REOT. |
| In the text | |
|
Fig. 9 Stabilization reactions: I (a), II (b), III (c), and IV (d). |
| In the text | |
Current usage metrics show cumulative count of Article Views (full-text article views including HTML views, PDF and ePub downloads, according to the available data) and Abstracts Views on Vision4Press platform.
Data correspond to usage on the plateform after 2015. The current usage metrics is available 48-96 hours after online publication and is updated daily on week days.
Initial download of the metrics may take a while.