")
")
| Issue |
OCL
Volume 17, Number 3, Mai-Juin 2010
Dossier : Tournesol : champs de recherche
|
|
|---|---|---|
| Page(s) | 185 - 192 | |
| Section | Fondamental | |
| DOI | https://doi.org/10.1051/ocl.2010.0309 | |
| Published online | 15 mai 2010 | |
Fatty acid composition of commercial vegetable oils from the French market analysed using a long highly polar column
1
Agence française de sécurité sanitaire des aliments, laboratoire d’études et de recherches sur la qualité des aliments et sur les procédés agroalimentaires, 23 avenue du Général-De-Gaulle, 94706 Maisons-Alfort cedex, France
2
Agence française de sécurité sanitaire des aliments, centre d’information sur la qualité des aliments, 27-31 avenue du Général-Leclerc, 94701 Maisons-Alfort cedex, France
Received:
28
January
2010
Accepted:
27
April
2010
Abstract
The increasing concern for consumed fat by western populations has raised the question of the level and the quality of fat intake, especially the composition of fatty acids (FA) and their impact on human health. As a consequence, consumers and nutritionists have requested updated publications on FA composition of food containing fat. In the present study, fourteen different kinds of edible oils (rapeseed, olive, hazelnut, argan, groundnut, grape seed, sesame, sunflower, walnut and organic walnut, avocado, wheat germ, and two combined oils) were analysed for FA determination using a BPX-70 60 m highly polar GC column. Oils were classified according to the classification of Dubois et al. (2007, 2008). Monounsaturated FA (MUFA) group oils, including rapeseed, olive, hazelnut, and avocado oils, contained mainly oleic acid (OA). Groundnut and argan oils, also rich in MUFA, showed in addition high linoleic acid (LA) contents. In the polyunsaturated (PUFA) group, grape seed oil presented the highest LA content while sunflower, sesame, and wheat germ oils showed noticeable MUFA amounts in addition to high PUFA contents. Walnut oils, also rich in LA, showed the highest linolenic acid (ALA) content. The n-6/n-3 ratio of each oil was calculated. Trans-FA (TFA) was also detected and quantified. Results were compared with the data published during the past decade, and the slight discrepancies were attributed to differences in origin and variety of seed-cultivars, and in seed and oil processes.
Key words: fatty acids / vegetable oils / composition / polar column
© John Libbey Eurotext 2010
Introduction
Interest in the specific fatty acid (FA) composition of oils has been emerging with the growing scientific evidence that all fats are not equivalent in regard to consumers’ health. French scientists from public health or food research institutes have recommended daily amounts for each types of FA, i.e., saturated (SFA), monounsaturated (MUFA), polyunsaturated (PUFA), and trans-fatty acids (TFA), as well as for specific fatty acids such as linoleic (LA), linolenic acids (ALA), and long-chain PUFA (AFSSA, 2005; Legrand et al., 2001). With these recent concerns about specific biological properties of individual FA, consumers as well as food industry have paid attention to FA composition of vegetable oils, seeking wider diversity. A new market has arisen with providers proposing dozens of edible oils, including traditionally produced and locally consumed oils, vegetable oils previously used as ingredients in cosmetic formulations, and new mixtures of vegetable oils combined to balance FA proportions, especially essential PUFAs.
In this new context, the Information Centre on Food Quality of the French Food Safety Agency (Afssa-Ciqual) sought to update the French reference food composition tables regarding FA composition of edible oils. Afssa-Ciqual has published the French food composition tables on the Internet, available for consumers, food industries, health care professionals, and other scientists as reference data (Afssa-Ciqual). The aim of this study was to analyse the FA composition of edible oils using an efficient highly polar middle length GC column in order to provide accurate FA profiles of main oils commonly consumed in France at the present time, as well as FA composition of specific new oils.
Material and methods
Chemicals
Fatty acid methyl ester (FAME) standards, including nonanoic acid methyl ester C9:0 used as internal standard, and Supeclo 37 component FAME mix #47885-U were purchased from Sigma-Aldrich France (Saint Quentin Fallavier, F). Anhydrous milk fat certified reference material (CRM) 164 was purchased from the UE-CBR (Brussels, B). All other reagents were analytical grade from various trademarks.
Sampling
Eleven kinds of vegetable oils, either representative of the French diet pattern or missing in CIQUAL data base, were sampled. Following the usual sampling procedure applied by the Afssa-Ciqual, a cost-effective convenience sampling plan was applied. Five bottles of major trademarks of each kind of oils were purchased in January 2007 from several supermarkets in N.E. of France and were mixed together in equivalent proportions. In addition, a virgin avocado oil, a virgin wheat germ oil, and an organic virgin walnut oil (unavailable in supermarkets) were bought in specialised organic groceries and individually analysed. Two distinct brands among the five walnut oils composing the mixture sample were also individually analysed to check trans-FA contents. Details on samples are given in table 1 .
Oil samples (information obtained from packaging or from producers).
Fatty acid esterification
Fatty acid methyl esters (FAMEs) were prepared using sodium methoxide as a catalyst. In brief, a 50 mg portion of vegetable oil was weighed to the nearest 0.1 mg in a reacting flask. Then 1 mL internal standard solution (1 mg C9:0 99% purity/mL in hexane) was added and the flask was shaken vigorously. 2 mL 0.5N sodium methoxide was then added, and the flask was vigorously shaken again for 1 min. before being heated to 40 °C for 30 min., with vigorous shaking at regular intervals. Then 100 μL glacial acetic acid, 4 mL distilled water, and 4 mL hexane were successively added, and the flask was vigorously shaken each time. The flask was then centrifuged, and the supernatant was stored at – 80 °C under nitrogen until the GC analysis, if necessary.
For the GC analysis, 50 μL of FAME solution was diluted in 1 mL hexane, and then 0.5 μL was injected in GC. Methylation and analysis were performed in duplicate for each sample at the same time.
Chromatographic conditions for FA analysis
GC analysis was carried out on an Agilent 6890N gas chromatograph (Agilent Technologies Inc., Massy, F) equipped with an Agilent 7683 autosampler, an on-column injector set in “track oven” mode (which means that the injector temperature is always 3 °C higher than the oven temperature) and a flame-ionisation detector (FID) set at 255 °C. Signal acquisition was computed with a Varian Galaxie® software data system (Varian Inc., Les Ulis, F). A BPX-70 (60 m × 0.25 mm i.d., 0.25 μm film; SGE Europe Ltd, Courtaboeuf, F) flexible fused-silica-column was used with column inlet pressure set at 110 kPa (constant pressure), hydrogen as the carrier gas, and the following temperature programme: 60 °C (5 min) – 15 °C/min. 165 °C (1 min.) – 2 °C/min. 225 °C 4 min.
A reference solution was made in the lab by spiking a CRM164 FAME solution with a fish oil FAME solution plus some commercial FAME standards (including Supelco #47885-U). This lab-made reference FAME solution was used to determine as many FAME peaks as possible using the BPX-70 column under working conditions. Chromatographic peaks were identified by comparison with several typical chromatograms such as: individual FAME reference chromatograms, CRM164 chromatograms (before and after spiking with reference FAME solutions), as well as chromatograms of both lab-made reference FAME and CRM164 FAME fractions from silver nitrate impregnated thin-layer chromatography [determination of saturated FA, mono-cis FA, trans-FA, and polyunsaturated fatty acid (PUFA) subclasses], and finally chromatograms reported in the literature under the same chromatographic conditions (Vingering and LeDoux, 2009). The lab-made reference FAME solution and Supelco #47885-U standard were injected twice each (at the beginning and at the end of a series sequence, after blanks) during each series of chromatographic runs as qualitative standards to check the FAME retention times and to identify peaks in samples by comparison of chromatograms. The FAME overlaps occurring when using the BPX-70 60-m column were described and discussed earlier (Vingering and LeDoux, 2009).
The correction factors were determined and calculated as previously reported (Vingering and LeDoux, 2009). A control oil with a simple FA profile was made in the lab by mixing non-refined olive and walnut oils. After homogenisation, small portions of the mixture were poured into amber vials and stored under nitrogen at – 28 °C, until use. Ten aliquots of this control oil were first methylated in duplicate following the working conditions and analysed using BPX-70 column to check repeatability and accuracy. A sample of this lab-made control oil mixture is systematically thawed and added as a quantitative control in each series of GC runs to regularly check the performance of the method. All FAMEs were quantified against C9:0 FAME 99% purity as internal standard (Vingering and LeDoux, 2009).
Results and discussion
Fatty acid analysis
Ten aliquots of a lab-made control oil mixture were methylated and analysed in duplicate under working conditions. The results were in the range of the ISO/IDF Standard (ISO15885/IDF184, 2002) (data not shown).
All the oil FA composition analyses in the present study were made within the same series: samples were methylated the same day in duplicate and then analyzed on the BPX-70 60-m column within the same run. A typical chromatogram of a vegetable oil is shown in Figure 1.
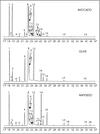 |
Figure 1. Partial chromatograms* of FAME prepared from 3 vegetable oils. Analyses on a BPX-70 column (60 m × 0.25 mm i.d., 0.25 μm film; SGE Europe Ltd), hydrogen as carrier gas and temperature programme as followed: 60°C (5 min) – 15 °C/min. 165 °C (1 min.) – 2 °C/min. 225°C 4 min. Peak identification: 1. 16:0; 2. 7c-16:1 (n-9); 3. 9c-16:1 (n-7); 4. 17:0; 5. 9c-17:1 (n-9); 6. 18:0; 7. trans-18:1; 8. 9c-18:1 (n-9); 9. 11c-18:1 (n-7); 10. 9c,12t-18:2 (n-6); 11. 9t,12c-18:2 (n-6); 12. 9c,12c-18:2 (n-6); 13. trans-18:3 (n-3); 14. 9c,12c,15c-18:3 (n-3); 15. 20:0; 16. 11c-20:1 (n-9); 17. 22:0; 18. 13c-22:1 (n-9); 19. 24:0; 20. 15c-24:1 (n-9).*The 3 chromatograms are presented at the same scale for both the x- and y-axis. |
The use of a 60-m highly polar GC capillary column allowed separation and identification of many fatty acids, including minor FAs, such as trans isomers. Only few authors (Ortiz Moreno et al., 2003; Noor Lida et al., 2002; Christopoulou et al., 2004) used such efficient middle length GC columns for studying FA composition of vegetable oils. Others worked with shorter columns (25-30 m) bonded with average or highly polar phases, the reason why poor information on specific minor FAs, such as TFA, were available in most publications (Juanéda et al., 2007).
Fatty acid composition of vegetable oils
The fatty acid composition of analysed oils is shown in table 2. All the duplicate results were in accordance with the ISO/IDF Standard (ISO15885/IDF184, 2002): the relative difference between two independent single test results, obtained using the same method on identical test material in the same laboratory by the same operator using the same equipment within a short interval of time, will be greater than 5% in not more than 5% of cases, with an absolute maximum of 1 g/100 g (FA > 5 g/100 g) or 12% with an absolute maximum of 0.5 g/100 g (1 g < FA < 5 g/100 g) (data not shown).
FA composition of analysed vegetable oils (in g FA/ 100 g oil).
Dubois et al., 2007, 2008 classified vegetable oils within different classes and subclasses according to their FA profiles. Results of this study are presented following this classification.
Oils from MUFA group
Rapeseed, olive, hazelnut, and avocado are MUFA rich oils, especially in oleic acid (18:1 n-9) with contents ranging from 50 (avocado) to 70 g/100 g of oil (olive, hazelnut). Dubois et al., 2007 classified these vegetable oils in the MUFA group, since MUFA were found to be major FAs in these fruits and seeds.
Our results regarding rapeseed oil FA composition are similar to the data from literature (Lee et al., 1998; Przybylski and Mag, 2002). Beside high contents of MUFAs with oleic acid as major FA, the rapeseed oil was found to be one of the richest oils in ALA (7.8 g/100 g oil) with a low LA n-6/ALA n-3 ratio (2.4), due to a low content in linoleic acid.
Olive oil is mainly a source of oleic acid (> 70% of total FAs) and shows the lowest content in linoleic acid compared to the other oils analysed in this study. Overall, our results regarding this oil are within the range of French and Greek olive cultivars FA composition (Ollivier et al., 2006, 2003; Boskou, 2002), but slightly lower than Italian, Korean, and Japanese olive oils regarding 16:0 and 18:2 n-6 contents and slightly higher for 18:3 n-3 content (Lee et al., 1998; Mannina et al., 2003; Ranalli et al., 2003). Our results are in accordance with specifications of trade standards for olive oils as defined by the International Olive Oil Council (IOOC). FA composition of various olive cultivars showed significant differences (Ollivier et al., 2003; Mannina et al., 2003), so olive oil FA profiles have been considered as a parameter to characterise a registered designation of origin (RDO) (Ollivier et al., 2006). Moreover, significant differences were observed between olive pulp and seed FA compositions (Ranalli et al., 2003).
Hazelnut oil shows the highest oleic acid contents (72.7 g/100 g oil). Our results are close to the FA profile reported for Turkish hazelnut oil with slight differences: OA content is slightly lower, and both LA and ALA contents are higher in the present study than in the Turkish one (Alasalvar et al., 2003).
In addition to a high oleic acid level, avocado oil shows high contents in two other MUFAs, palmitoleic (16:1 n-7) and cis-vaccenic (18:1 n-7) acid (respectively, 7.7 and 7.1 g/100 g oil), compared to other vegetable oils (from 0.1 to 0.8 g/100 g oil), confirming previous reports (Ortiz Moreno et al., 2003; Bora et al., 2001). Nevertheless, this oil shows the highest palmitic acid (16:0) content (16.9 g/100 g compared to 0.1 - 15.9 for other oils). In our study, the oleic (OA, 18:1 n-9), linoleic (LA, 18:2 n-6), and α-linolenic (ALA, 18:3 n-3) acid contents of avocado oil (respectively, 53.1%, 11.1%, and 0.6% of total FAs) are slightly lower than the average values reported for Mexican avocado (respectively, 60.3%, 13.7, and 1.4%) (Ortiz Moreno et al., 2003). These authors extracted oil from avocado pulp in their lab using four different methods including solvent and/or microwaves and observed a significant influence of extraction procedure on the FA profile. In our study, the analysed avocado oil, labelled as cold pressed oil, was bought in a specialised store and FAME was directly made from the oil sample. Considering individual results by Ortiz-Moreno et al., 2003, our results were close to their “microwaves/squeezing extracted oil” except for ALA which remained higher in Mexican avocado (1.8% of total FAs). A different cultivar from Brazil showed ALA content of avocado pulp oil as low as in our study (0.5% of total FAs) (Bora et al., 2001). These authors also reported that avocado pulp and seed oils showed significant differences in FA composition, the seed oil being much richer in PUFA than the pulp oil, especially both LA and ALA (Bora et al., 2001). Last point, the avocado oil studied here also contained trans-FAs as high as 0.5% of total FAs. Such a relatively high content is at the upper limit for TFA contents in cold pressed oils (Brühl, 1995). Such TFA contents were previously reported while testing various extraction procedures in laboratory, ranging from 0.3 to 0.9% of total FAs depending on the method of oil extraction from avocado pulp (Ortiz-Moreno et al., 2003). As we used a moderate methylation procedure with sodium methoxide as catalyst in small amounts of hexane in order to reduce the risk of generating TFAs during analysis, TFAs from avocado oil were probably present either in avocado pulp or/and generated during process. On the other hand, we did not find any TFA, even as traces, in virgin wheat germ, walnut oils, or olive oil mixtures in the present study (table 2), so the methodology used here did not seem to generate TFAs.
MUFA/SFA + LA subclass
Groundnut and argan oils were classified as MUFA (group)/SFA + LA (subclass) oils since average SFA and LA contents were higher than in the MUFA group/MUFA subclass (Dubois et al., 2007). Major FAs in groundnut oil are found to be oleic acid and then linoleic acid. The present results are comparable to some previously reported data (Sanders, 2002; Dorschel, 2002), but SFA and LA contents in the tested groundnut oil mixture are slightly lower and OA content is slightly higher than the average values calculated by Dubois et al., 2007 from literature data. The ALA content of groundnut oil measured in the present study (0.1%) is lower than the published results for US oils (0.7%) (Dubois et al., 2007; Dorschel, 2002), but similar to findings for Greek oils (0.1%) (Christopoulou et al., 2004). The specificity of groundnut oil of containing long chain (C > 20) FAs, i.e., 20:0, 20:1, 22:0, and 24:0, is thus confirmed.
Argan oil, an exotic oil from Morocco, with putative biological properties interesting for human health (Charrouf and Guillaume, 2008), is more or less balanced in OA and LA as major FAs, with respectively, 40 and 33 g/100 g of oil and is also found to be rich in palmitic acid (16:0). Those findings are in agreement with data from literature (Rezanka and Rezankovà, 1999; Hilali et al., 2005). ALA content of argan oil is very low (0.1 g/100 g oil). Such low ALA contents have been observed in some argan oils from different origins (Hilali et al., 2005), but ALA contents as high as 3.8% have also been reported (Rezanka and Rezankovà, 1999).
Oils from PUFA group
Grape seed, sunflower, sesame, wheat germ, and walnut oils are rich in PUFAs with contents ranging from 40 (sesame) to 63 g (grape seed) PUFA/100 g oil. Grape seed has been classified in an LA subclass, sunflower, sesame, and wheat germ oils in an LA+MUFA subclass, and walnut oil in an LA+SFA subclass (table 2) (Dubois et al., 2007).
PUFA/LA subclass
Grape seed oil is the richest in PUFAs, representing 66.5% of total FAs, and has been classified in an LA subclass Dubois et al., 2007. Indeed, this oil shows the highest content in linoleic acid (63.3 g/100 g oil), but due to a poor linolenic acid content, the PUFA n-6/PUFA n-3 ratio is very high. Our results regarding FA composition of grape seed oil are quite similar to those previously reported, with only few differences (Udayasekhara Rao, 1994; Sovová et al., 2001). Grape seed oil from India contained 8.1% of myristic acid (14:0) and less palmitic acid (16:0) (3.5%) than in the present study (7.2%). French grape seed oil showed slightly higher OA content and slightly lower LA content than those reported for grape seeds from Macedonia (Sovová et al., 2001). In addition, Sovová et al., 2001 reported the presence of 0.4% γ-linolenic acid (GLA, 18:3 n-6). However, in our study, chromatograms of FAMEs prepared from grape seed oil did not show any peak in the area of GLA elution, neither GLA nor trans-ALA (GLA overlapped with some trans-ALA on the BPX-70 60-m column under analytical conditions used in the present study (Vingering and LeDoux, 2009)).
PUFA/LA+MUFA subclass
Other PUFA oils like sunflower, sesame, and wheat germ oils also contain high MUFA amounts (Dubois et al., 2007).
The main fatty acids in “conventional” sunflower oil are linoleic and oleic acids, along with palmitic acid (Noor Lida et al., 2002; Guinda et al., 2003; Gupta, 2002; Wang, 2002), but field-grown mutant sunflower seeds can show much higher contents of oleic or oleic plus palmitic acids (Guinda et al., 2003). Sunflower oils analysed in the present study show an FA composition similar to the conventional sunflower oil profile (Codex Alimentarius).
Like argan oil, sesame oil is balanced in both OA and LA as major FAs, but contrary to argan, LA content was found to be higher than OA content. Such results are in accordance with previously reported data (Kochbar, 2002), even if LA content from the present study (42% of total FAs) was at the lowest limit of results from literature (Lee, et al., 1998; Abou-Gharbia et al., 2000; Alpaslan et al., 2001; Jahaniaval et al., 2000). Nevertheless, our results are within the range of values established by the Codex Alimentarius for sesame oil (Codex Alimentarius). Such low LA contents were also reported from sesame seeds in Turkey depending on the interaction between row space and irrigation effects (Alpaslan et al., 2001). Dubois et al., 2007 classified sesame oil in PUFA group and argan in MUFA group, but average LA content of sesame oil calculated from published data was higher than LA content measured in the present study. This is the reason why both argan and sesame oils, which have close FA compositions in our study, are presented in different groups in table 2.
Contrary to most of the oils analysed in the present study, the tested wheat germ oil is not a mixture, but a unique sample from a traditional local factory producing a virgin cold-pressed oil. However, our results are quite similar to the results previously reported for FA compositions of wheat germ oil extracted either by solvents at cold or hot temperatures (Dunford and Zhang, 2003), or supercritical CO2 (Panfili et al., 2003). Only small differences are observed, for instance OA content is slightly lower, and both LA and ALA contents are higher in the present study than in the reported data (Dunford and Zhang, 2003; Panfili et al., 2003). Moreover, LA and ALA contents of wheat germ oils extracted by solvents decreased with increasing temperatures during solvent extraction (Dunford and Zhang, 2003). No trans-PUFA is detected in the virgin wheat germ oil analysed in the present study, even as traces.
PUFA/LA+SFA subclass
Dubois et al., 2007 classified walnut oil in a PUFA group/LA +SFA subclass, but these authors used only Greek data (Tsamouris et al., 2001). The FA composition of the mixture made from 5 French walnut oils is quite different from the results obtained with Greek oil [40], but remains in accordance with data from Wolff (1993) for German and French oils. In the present work, as for Wolff’s results, the walnut oil mixture has lower SFA (10%) and much higher MUFA (17% of total FAs) contents than the Greek oil (respectively, SFA 15% and MUFA 1%). Regarding PUFA content, the French oil is poorer in 18:2 n-6 and richer in 18:3 n-3, with an LA n-6/ALA n-3 ratio of 4.8 against 7.4 for the Greek oil. The walnut oil mixture also presents a relatively high TFA content (0.86 g/100 g oil, representing 0.9% of total FAs). Deodorisation, the last step of oil refining, is known to be the main cause of trans-PUFA isomer formation during oil processing (LeDoux et al., 2007). Wolff (1993) reported TFA contents from 0.84% to 1.83% in refined walnut oils and 0.1% for virgin walnut oil.
In addition to the planed work, we analysed two walnut oils individually (walnut I & II, table 1 ) and an extra walnut oil (organic walnut III, table 1 ) labelled as virgin cold-pressed oil. Overall, the FA compositions of these three oils conform to our previous findings, including good LA n-6/ALA n-3 ratios (table 2). However, both the walnut I & II oils contained TFAs (respectively, 0.8% and 1.8% of total FAs) and both of these oils showed trans-18:2 as well as trans-18:3, while the FAME chromatograms for organic walnut oil did not show any TFA, even as traces.
Variation factors of oil FA composition
The present study recalls and underlines the specificity of the analysed vegetable oils in terms of their FA composition, an often used criterion for the general classification of oils and fats, recently revisited by Dubois et al., 2007. Overall, our results are in agreement with the average of the vegetable oil FA compositions published in literature in the past decade for the same oils as well as in the FA compositions given by the Codex Alimentarius standard for named vegetable oils (Codex Alimentarius). However, differences were observed between our results and published data for some FA contents of several oils. These differences could be explained by various reasons.
Significant differences in FA profiles were reported for the same kind of oil in relation with several parameters. Among influencing factors, the cultivar and the origin of the oleaginous plant have been quoted (Lee et al., 1998; Ollivier et al., 2006; Ollivier et al., 2003; Mannina et al., 2003; Guinda et al., 2003). In contrast, numerous varieties of a same oleaginous fruit from different geographical origins have been reported to have very close FA compositions (Hilali et al., 2005). Changes in total FA amounts as well as in FA proportions were also observed during development of oilseeds (Chung et al., 1995) and, for a same vegetable, pulp and seed can shows drastic differences in their FA compositions (Ranalli et al., 2003; Bora et al., 2001).
Overview
Figure 2 shows the SFA, MUFA, and PUFA distributions of the different analysed oils. Only few variations are observed regarding SFA contents, from 7 to 19% of total FAs depending on the oil. In all oils, palmitic acid (16:0) is always the major SFA, followed by stearic acid (18:0). Other SFAs, such as 14:0, 20:0, 22:0, and 24:0, are minor. On the other hand, both MUFA and PUFA contents show drastic variations depending on oleaginous species and vary respectively from 14.4 to 77.5% (MUFA) and from 7.1 to 66.5% (PUFA) of total FAs. Oleic acid (18:1 n-9) is always the major MUFA and linoleic acid (LA, 18:2 n-6) is the major PUFA. Only three pure (non-combined) oils show α-linolenic acid (ALA, 18:3 n-3) contents higher than 7 g/100 g oil: wheat germ (7.1 g/ 100 g), rapeseed (7.8), and walnut (11.9). The LA n-6/ALA n-3 ratios of these oils are respectively, 7.5 (wheat germ), 2.4 (rapeseed), and 4.8 (walnut). Both rapeseed and walnut oils, having a high LA content and a low LA/ALA ratio, turn out to be interesting oils to increase ALA intakes in the French diet with an adequate balance between LA and ALA contents.
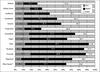 |
Figure 2. SFA, MUFA, and PUFA distributions (in% of total FAs) in analyzed vegetable oils. |
As a particular attention is now being paid to trans-fatty acids (Mozaffarian et al., 2006; Baylin et al., 2003), we examined the TFA contents of the oils. Olive and argan oil mixtures, as well as organic wheat germ and walnut oils did not present any trans fatty acids even as traces. All other oil mixtures and avocado oil showed low trans-18:2 and trans-18:3 isomer contents (from 0.1 to 0.9 g total TFA/100 g oil) representing about 0.1 to 0.9% of total FAs. Both the individually analysed walnut oils showed TFA contents, with walnut II sample as high as 1.7 g total TFA/ 100 g oil. These trans-PUFA are mainly produced during the deodorisation step of oil refining process (Wolff, 1993a, 1993b). Avocado oil was the only oil to contain trans-18:1 isomers as low as 0.1% of total FAs. Crude vegetable oils with such low TFA contents are not considered to be significant contributors to TFA intakes (Laloux et al., 2007).
Conclusion
The French experts in the lipid nutrition field have recommended through the French Food Safety Agency (Afssa) that lipids should represent from 35% to 40% of the total energy intake (AFSSA, 2010). In western diets, these recommendations are not met since lipids represent more than 40% of the total energy intake. In parallel to this “quantity of fat” aspect, a “quality of fat” consideration is emerging since the recommendations also require less than 33% of lipid intake to be SFA, and an LA/ALA ratio of about 4 (AFSSA, 2010) as well as the reduction of TFA (AFSSA, 2005), even if TFA intake by French population remains lower than in some other industrial countries (Laloux et al., 2007). Consequently, French Food composition databank (Afssa-Ciqual) has undertaken a new set of nutrient analyses of some of the key foods cited in the latest French food consumption survey. The present paper reports the FA composition of several vegetable oils. The results underline that, when considering the nutritional needs of consumer, oils should be chosen according to their different FA profiles.
References
- Dubois V, Breton S, Linder M, Fanni J, Parmentier M. Fatty acid profiles of 80 vegetable oils with regard to their nutritional potential. Eur J Lipid Sci Technol 2007; 109 : 710–732. [CrossRef] [Google Scholar]
- Dubois V, Breton S, Linder M, Fanni J, Parmentier M. Proposition de classement des sources végétales d’acides gras en fonction de leur profil nutritionnel. OCL 2008; 15 : 56–75. [CrossRef] [EDP Sciences] [Google Scholar]
- AFSSA. Acides gras trans. Risques et bénéfices pour la santé. Recommandations. AFSSA: Maisons Alfort, France, 2005. [Google Scholar]
- Legrand P, Bourre JM, Descomps B, Durand G, Renaud S. Lipides. In: Martin A ed. Apports nutritionnels conseillés pour la population française. Paris: Lavoisier Tec & Doc, 2001: 63–82. [Google Scholar]
- Afssa-Ciqual, Food table composition, http://www.afssa.fr/TableCIQUAL. [Google Scholar]
- Vingering N, LeDoux M. Use of a BPX-70 60m column for screening the fatty acid composition of industrial cookies. Eur J Lipid Sci Technol 2009; 111 : 669–677. [CrossRef] [Google Scholar]
- ISO15885/IDF184, Milk fat - Determination of the fatty acid composition by gas-liquid chromatography., in ISO Geneva (CH)/IDF Brussels (BE), 2002: 1–8. [Google Scholar]
- Ortiz Moreno A, Dorantes L, Galindez J, Guzmán RI. Effect of different extraction methods on fatty acids, volatile compounds, and physical and chemical properties of Avocado (Persea americana Mill.) oil. J Agric Food Sci 2003; 51 : 2216–2221. [CrossRef] [PubMed] [Google Scholar]
- Noor Lida HMD, Sundram K, Aminah A, Mamot S. TAG composition and solid fat content of palm oil, sunflower oil, and palm kernel olein blends before and after chemical interesterification. J Am Oil Chem Soc 2002; 79 : 1137–1144. [CrossRef] [Google Scholar]
- Christopoulou E, Lazaraki M, Komaitis M, Kaselimis K. Effectiveness of determination of fatty acids and triglycerides for the detection of adulteration of olive oils with vegetable oils. Food Chemistry 2004; 84 : 463–474. [CrossRef] [Google Scholar]
- Juanéda P, LeDoux M, Sébédio JL. Analytical methods for determination of trans fatty acid content in food. Eur J Lipid Sci Technol 2007; 109 : 901–917. [CrossRef] [Google Scholar]
- Lee DS, Noh BS, Bae SY, Kim K. Characterization of fatty acids composition in vegetable oils by gas chromatography and chemometrics. Analytica Chimica Acta 1998; 358 : 163–175. [CrossRef] [Google Scholar]
- Przybylski R, Mag TK. Canola/rapeseed oil. In: Gunstone FD ed. Vegetable oils in food technology, composition, properties, and uses. Oxford (UK): Blackwell Publishing Ltd., 2002: 99–127. [Google Scholar]
- Ollivier D, Artaud J, Pinatel C, Durbec JP, Guérère M. Differentiation of French virgin olive oil RDOs by sensory characteristics, fatty acids and triacylglycerol compositions and chemometrics. Food Chemistry 2006; 97 : 382–393. [CrossRef] [Google Scholar]
- Ollivier D, Artaud J, Pinatel C, Durbec JP, Guérère M. Triacylglycerol and fatty acid compositions of Fench virgin olive oils. Characterization by chemometrics. J Agric Food Chem 2003; 51 : 5723–5731. [CrossRef] [PubMed] [Google Scholar]
- Boskou D. Olive oil. In: Gunstone FD ed. Vegetable oils in food technology, composition, properties, and uses. Oxford (UK): Blackwell Publishing Ltd., 2002: 244–277. [Google Scholar]
- Mannina L, Dugo G, Salvo F, et al. Study of the cultivar-composition relationship in Sicilian olive oils by GC, NMR, and statistical methods. J Agric Food Sci 2003; 51 : 120–127. [CrossRef] [Google Scholar]
- Ranalli A, Pollastri L, Contento S, et al. Acylglycerol and fatty acid components of pulp, seed, and whole olive fruit oils Their use to characterize fruit variety by chemometrics. J Agric Food Sci 2003; 50 : 3775–3779. [CrossRef] [Google Scholar]
- International Olive Oil Council, Trade standard applying to olive oils and olive-pomace oils. www.internationaloliveoil.org. [Google Scholar]
- Alasalvar C, Shahidi F, Oshima T, et al. Turkish tombul hazelnut (Corylus avellana L.). 2. Lipid characteristics and oxidative stability. J Agric Food Sci 2003; 51 : 3797–3805. [CrossRef] [Google Scholar]
- Bora PS, Narain N, Rocha RVM. Queiroz Paulo M. Characterization of the oils from the pulp and seeds of avocado (cultivar: Fuerte) fruits. Grasas y Aceites 2001; 52 : 171–174. [Google Scholar]
- Brühl L. Determination of trans fatty acids in cold pressed oils. Eur J Med Res 1995; 1 : 89–93. [PubMed] [Google Scholar]
- Sanders TH. Groundut (peanut). In: Gunstone FD ed. Vegetable oils in food technology, composition, properties, and uses. Oxford (UK): Blackwell Publishing Ltd., 2002: 231–243. [Google Scholar]
- Dorschel CA. Characterization of the TAG of peanut oil by electrospray LC-MS-MS. J Am Oil Chem Soc 2002; 79 : 749–753. [CrossRef] [Google Scholar]
- Charrouf Z, Guillaume D. Argan oil: Occurrence, composition and impact on human health. Eur J Lipid Sci Technol 2008; 110 : 632–636. [CrossRef] [Google Scholar]
- Rezanka T, Rezankovà H. Characterization of fatty acids and triacylglycerols in vegetable oils by gas chromatography and statistical analysis. Analytica Chimica Acta 1999; 398 : 253–261. [CrossRef] [Google Scholar]
- Hilali M, Charrouf Z, Soulhi AEA, Hachimi L, Guillaume D. Influence of origin and extraction method on argan oil physico-chemical characteristics and composition. J Agric Food Sci 2005; 53 : 2081–2087. [CrossRef] [PubMed] [Google Scholar]
- Udayasekhara Rao P. Nutrient composition of some less-familiar oil seeds. Food Chemistry 1994; 50 : 379–382. [CrossRef] [Google Scholar]
- Sovová H, Zarevúcka M, Vack M, Stránsky K. Solubility if two vegetable oils in supercritical CO2. J Supercrit Fluids 2001; 20 : 15–28. [CrossRef] [Google Scholar]
- Guinda A, Dobarganes MC, Ruiz-Mendez MV, Mancha M. Chemical and physical properties of a sunflower oil with high levels of oleic and palmitic acids. Eur J Lipid Sci Technol 2003; 105 : 130–137. [CrossRef] [Google Scholar]
- Gupta MK. Sunflower oil. In: Gunstone FD ed. Vegetable oils in food technology, composition, properties, and uses. Oxford (UK): Blackwell Publishing Ltd., 2002: 128–156. [Google Scholar]
- Wang T. Soybean oil. In: Gunstone FD ed. Vegetable oils in food technology, composition, properties, and uses. Oxford (UK): Blackwell Publishing Ltd., 2002: 18–58. [Google Scholar]
- Codex Alimentarius, Codex standard for named vegetable oils. Codex Stan 210, www.codexalimentarius.net. [Google Scholar]
- Kochbar SP. Sesame, rice-bran, and flaxseed oils. In: Gunstone FD ed. Vegetable oils in food technology, composition, properties, and uses. Oxford (UK): Blackwell Publishing Ltd., 2002: 297–326. [Google Scholar]
- Abou-Gharbia HA, Shehata AAY, Shahadi F. Effect of processing on oxidative stability and lipid classes of sesame oil. Food Research International 2000; 33 : 331–340. [CrossRef] [Google Scholar]
- Alpaslan M, Boydak E, Hayla M, Gerçek S, Simsek M. Effect of row space and irrigation on seed composition of Turkish sesame (Sesamum indicum L.). J Am Oil Chem Soc 2001; 78 : 933–935. [CrossRef] [Google Scholar]
- Jahaniaval F, Kakuda Y, Marcone MF. Fatty acid and triacylglycerol compositions of seed oils of five Amaranthus accessions and their comparison to other oils. J Am Oil Chem Soc 2000; 77 : 847–852. [CrossRef] [Google Scholar]
- Dunford NT, Zhang M. Pressurized solvent extraction of wheat germ oil. Food Research International 2003; 36 : 905–909. [CrossRef] [Google Scholar]
- Panfili G, Cinquanta L, Fratianni A, Cubadda R. Extraction of wheat germ oil by supercritical CO2: oil and defatted cake characterization. J Am Oil Chem Soc 2003; 80 : 157–161. [CrossRef] [Google Scholar]
- Tsamouris G, Hatziantoniou S, Demetzos C. Lipid analysis of Greek walnut oil (Juglans regia L.). Z Naturforsch 2001; 57c : 51–56. [Google Scholar]
- Wolff RL. Occurrence of artificial trans-polyunsaturated fatty acids in refined (deodorized) walnut oils. Sci Alim 1993; 13 : 155–163. [Google Scholar]
- LeDoux M, Juanéda P, Sébédio JL. Trans fatty acids: Definition and occurrence in foods. Eur J Lipid Sci Technol 2007; 109 : 891–900. [CrossRef] [Google Scholar]
- Chung CH, Lee YJ, Kim DH, Kim HK, Chung DS. Changes of lipid, protein, RNA and fatty acid composition in developing sesame (Sesamum indicum L.) seeds. Plant Sci 1995; 109 : 237–243. [CrossRef] [Google Scholar]
- Mozaffarian D, Katan MB, Ascherio A, Stampfer MJ, Willett WC. Trans fatty acids and cardiovascular disease. New Engl J Med 2006; 354 : 1601–1613. [CrossRef] [PubMed] [Google Scholar]
- Baylin A, Kabagambe EK, Ascherio A, Spiegelman D, Campos H. High 18:2 trans-fatty acids in adipose tissue are associated with increased risk of nonfatal acute myocardial infarction in costa rican adults. J Nutr 2003; 133 : 1186–1191. [PubMed] [Google Scholar]
- Wolff RL. Further studies on artificial geometrical isomers of alpha-linolenic acid in edible linolenic acid-containing oils. J Am Oil Chem Soc 1993a; 70 : 219–224. [CrossRef] [Google Scholar]
- Wolff RL. Heat-induced geometrical isomerization of linoleic acid : effect of temperature and heating time on the appearance of individual isomers. J Am Oil Chem Soc 1993b; 70 : 425–430. [CrossRef] [Google Scholar]
- Laloux L, du Chaffaut L, Razanamahefa L, Lafay L. Trans fatty acid content of foods and intake levels in France. Eur J Lipid Sci Technol 2007; 109 : 918–929. [CrossRef] [Google Scholar]
- AFSSA, Avis relatif à l’actualisation des apports nutritionels conseillés pour les acides gras (Saisine n°2006-SA-0359). 2010. [Google Scholar]
All Tables
All Figures
|
Figure 1. Partial chromatograms* of FAME prepared from 3 vegetable oils. Analyses on a BPX-70 column (60 m × 0.25 mm i.d., 0.25 μm film; SGE Europe Ltd), hydrogen as carrier gas and temperature programme as followed: 60°C (5 min) – 15 °C/min. 165 °C (1 min.) – 2 °C/min. 225°C 4 min. Peak identification: 1. 16:0; 2. 7c-16:1 (n-9); 3. 9c-16:1 (n-7); 4. 17:0; 5. 9c-17:1 (n-9); 6. 18:0; 7. trans-18:1; 8. 9c-18:1 (n-9); 9. 11c-18:1 (n-7); 10. 9c,12t-18:2 (n-6); 11. 9t,12c-18:2 (n-6); 12. 9c,12c-18:2 (n-6); 13. trans-18:3 (n-3); 14. 9c,12c,15c-18:3 (n-3); 15. 20:0; 16. 11c-20:1 (n-9); 17. 22:0; 18. 13c-22:1 (n-9); 19. 24:0; 20. 15c-24:1 (n-9).*The 3 chromatograms are presented at the same scale for both the x- and y-axis. |
| In the text | |
|
Figure 2. SFA, MUFA, and PUFA distributions (in% of total FAs) in analyzed vegetable oils. |
| In the text | |
Current usage metrics show cumulative count of Article Views (full-text article views including HTML views, PDF and ePub downloads, according to the available data) and Abstracts Views on Vision4Press platform.
Data correspond to usage on the plateform after 2015. The current usage metrics is available 48-96 hours after online publication and is updated daily on week days.
Initial download of the metrics may take a while.