")
")
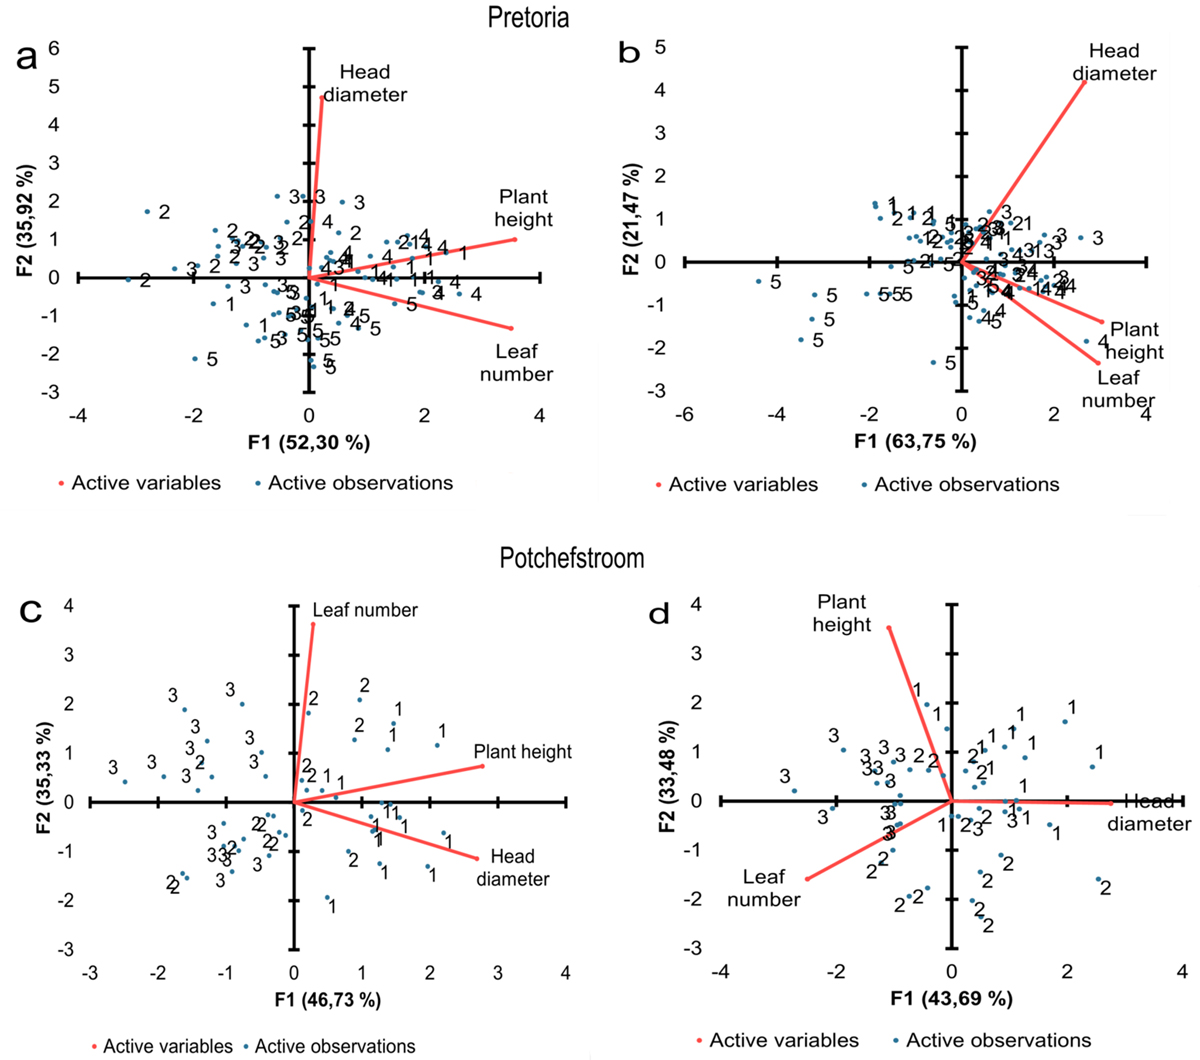
Fig. 3
Download original image
Principal component analysis for leaf number, plant height, and head diameter for the austral summer 2020/2021 season and 2021/2022 season at the Pretoria site (a and b) and the Potchefstroom site (c and d). Different numbers represent planting dates: 1: November, 2: December, 3: January, 4: February, and 5: March for the Pretoria site. F1 (y-axis) represents the first principal component, with the highest total variance. F2 (x-axis) represents the second principal component, with the second highest total variance. The red lines represent the active variables (leaf number, plant height, and head diameter), and the blue dots indicate the active observations (individual samples per planting date, n = 3).
Current usage metrics show cumulative count of Article Views (full-text article views including HTML views, PDF and ePub downloads, according to the available data) and Abstracts Views on Vision4Press platform.
Data correspond to usage on the plateform after 2015. The current usage metrics is available 48-96 hours after online publication and is updated daily on week days.
Initial download of the metrics may take a while.