")
")
Fig. 4
Download original image
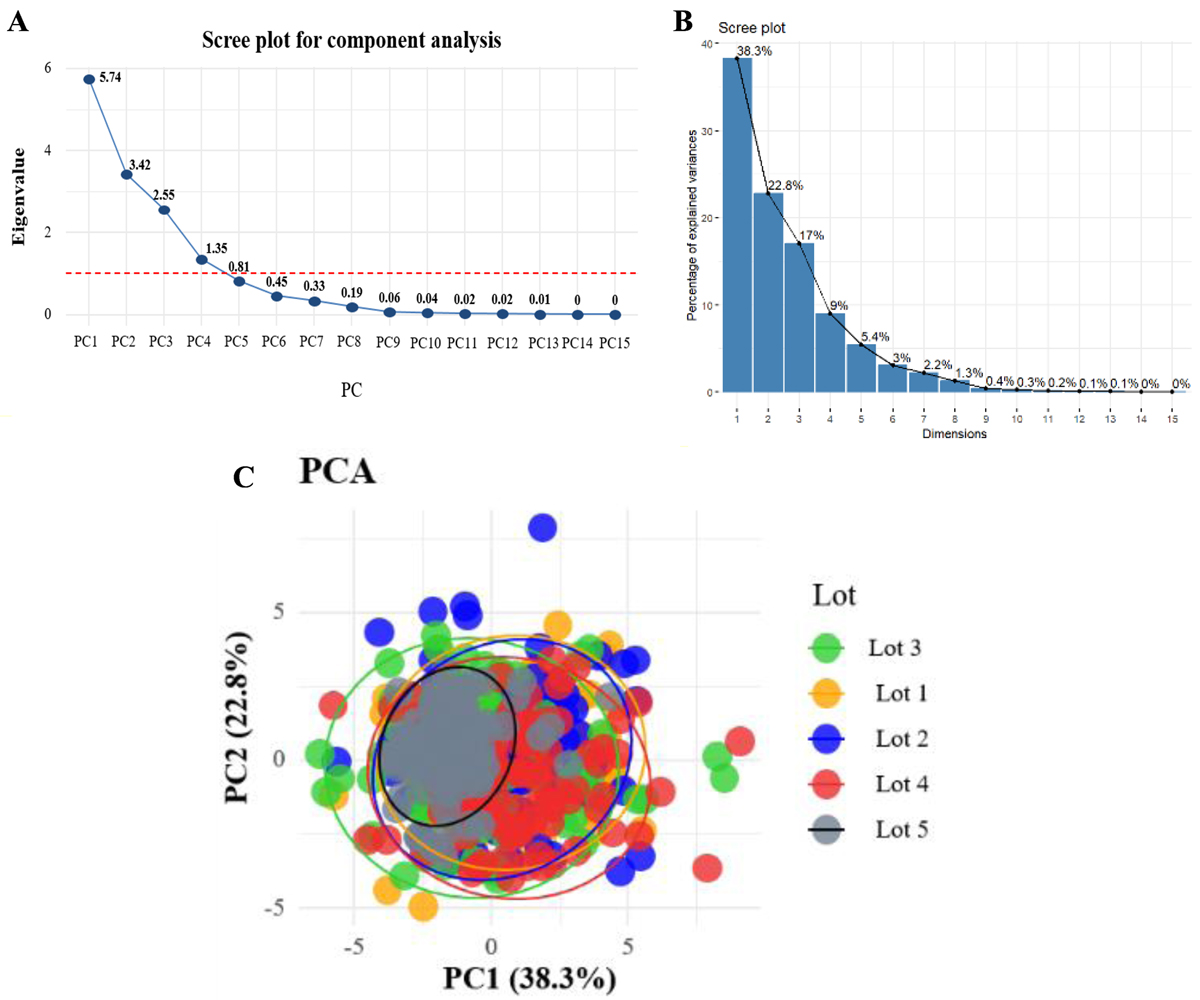
A) Scree plot of the eigenvalues for each extracted component, the red dashed line represents the Kaiser criterion (eigenvalue >1). B) Scree plot of the percentages of variance explained for the first 10 principal components. C) Principal Component Analysis obtained for morphometric data from jojoba seeds (n = 500), showing the distribution of the five lots evaluated. Each point represents an individual seed, colored according to the original lot, and the ellipses indicate the dispersion of the data with a 95% confidence interval for each lot.
Current usage metrics show cumulative count of Article Views (full-text article views including HTML views, PDF and ePub downloads, according to the available data) and Abstracts Views on Vision4Press platform.
Data correspond to usage on the plateform after 2015. The current usage metrics is available 48-96 hours after online publication and is updated daily on week days.
Initial download of the metrics may take a while.