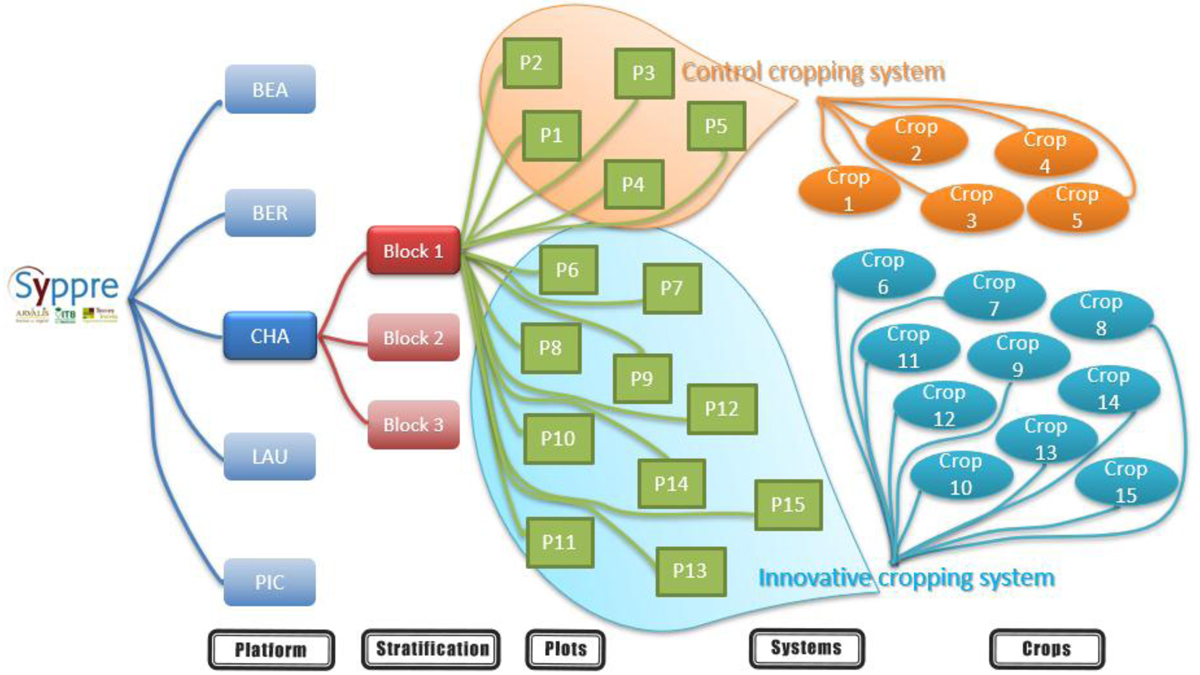
Fig. 3

Download original image
Conceptual diagram of the experimental design of the Syppre’s experimental network. It is a simplified representation of the components and their interactions in a given year. It is based on the models presented by (Zuur et al., 2009) in order to translate the physical and technical components of the system experiment into statistical components. The block 1 structure is representative of the two other blocks (repetition of the experiment), and the CHA (Champagne) platform is representative of the four other platforms (BEA: Béarn, BER: Berry, LAU: Lauragais, PIC: Picardie). Plots are elementary units on which measurements are made. They were randomly assigned to a cropping system. An initial crop was randomly assigned to each plot at the beginning of the experiment. All crops follow each other on each plot across the years according to the crop sequence. In order to retain the diagram’s clarity, the randomization of the experimental layout is not presented.
Les statistiques affichées correspondent au cumul d'une part des vues des résumés de l'article et d'autre part des vues et téléchargements de l'article plein-texte (PDF, Full-HTML, ePub... selon les formats disponibles) sur la platefome Vision4Press.
Les statistiques sont disponibles avec un délai de 48 à 96 heures et sont mises à jour quotidiennement en semaine.
Le chargement des statistiques peut être long.


