")
")
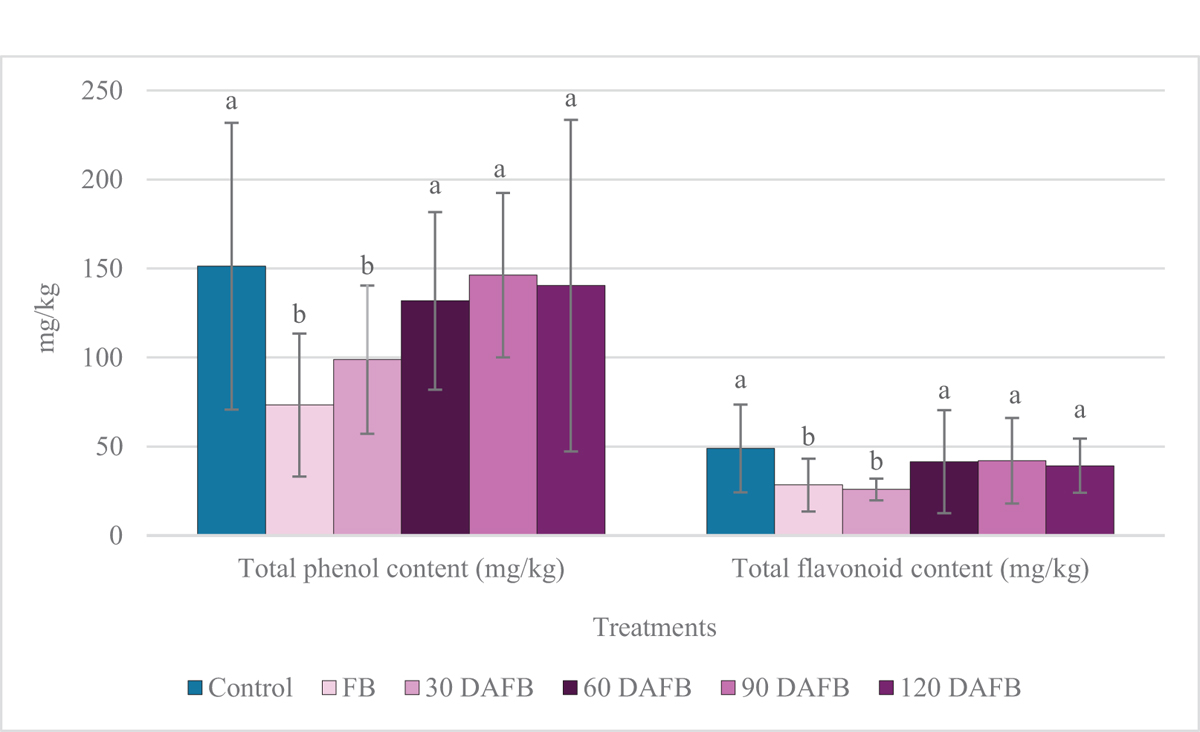
Fig. 5
Download original image
Total phenolic and flavonoid content in extra virgin olive oil (EVOO) from cv. Arbequina trees. Bars represent the means ± standard deviation of three growing seasons (2017–2018, 2018–2019, and 2019–2020). Different letters above bars indicate significant difference among treatments according to the DGC-test (p ≤ 0.05).
Current usage metrics show cumulative count of Article Views (full-text article views including HTML views, PDF and ePub downloads, according to the available data) and Abstracts Views on Vision4Press platform.
Data correspond to usage on the plateform after 2015. The current usage metrics is available 48-96 hours after online publication and is updated daily on week days.
Initial download of the metrics may take a while.