")
")
| Issue |
OCL
Volume 33, 2026
Contaminants in oils and fats / Contaminants des huiles et corps gras
|
|
|---|---|---|
| Article Number | 16 | |
| Number of page(s) | 10 | |
| DOI | https://doi.org/10.1051/ocl/2026009 | |
| Published online | 21 April 2026 | |
Research article
Influence of empty fruit bunch oil on crude palm oil quality and refining characteristics☆
Influence de l’huile de rafles vides sur la qualité et les caractéristiques de raffinage de l’huile de palme brute
Analytical & Quality Development Unit, Product Development & Advisory Services Division,
Malaysian Palm Oil Board, 6, Persiaran Institusi, Bandar Baru Bangi,
43000
Kajang,
Selangor,
Malaysia
* Corresponding author: This email address is being protected from spambots. You need JavaScript enabled to view it.
Received:
25
August
2025
Accepted:
10
March
2026
Abstract
This study examined the composition of oil extracted from empty fruit bunches (EFB) and its effects on the refining, fractionation, and occurrence of process-developed contaminants in palm oil. The oil, referred to as empty fruit bunch oil (EFBO), was extracted from EFB liquor, which consisted of 85 % water, 10 % sludge, and 5 % oil. The EFBO was then blended with crude palm oil (CPO) at varying concentrations (0.1 %, 0.5 %, 1.0 %, 2.5 %, 5.0 %, and 10 %) and subjected to physical refining and dry fractionation. Quality analyses revealed that increasing EFBO concentrations led to higher free fatty acid (FFA) levels above 0.4 % and more intense colour above 2.4R in the refined oils. The EFBO also contributed to the formation of process-developed contaminants, particularly 3-monochloropropane-1,2-diol esters (3-MCPDE), from 1.14 mg kg−1 in control oil to 2.72 mg kg−1 in refined oil with 10 % EFBO added, while the formation of glycidyl esters (GE) was less influenced by the addition of EFBO. During dry fractionation, both 3-MCPDE and GE were found to be more concentrated in the liquid olein fraction than in the solid stearin fraction, governed by inherent physicochemical properties rather than the blended oil composition. The study concluded that blending EFBO with CPO could degrade the quality and safety of CPO, mainly due to the increased formation of undesirable contaminants such as 3-MCPDE.
Résumé
Cette étude a examiné la composition de l’huile extraite des rafles vides (empty fruit bunches, EFB) et ses effets sur le raffinage, le fractionnement ainsi que sur la formation de contaminants générés au cours des procédés dans l’huile de palme. L’huile, appelée huile de rafles vides (empty fruit bunch oil, EFBO), a été extraite des effluents d’EFB, composés de 85 % d’eau, 10 % de boues et 5 % d’huile. L’EFBO a ensuite été mélangée à de l’huile de palme brute (crude palm oil, CPO) à différentes concentrations (0,1 %, 0,5 %, 1,0 %, 2,5 %, 5,0 % et 10 %), puis soumise à un raffinage physique et à un fractionnement à sec. Les analyses de qualité ont montré qu’une augmentation de la teneur en EFBO entraînait une élévation des acides gras libres (AGL) au-delà de 0,4 % et une intensification de la couleur au-delà de 2,4R dans les huiles raffinées. L’EFBO a également contribué à la formation de contaminants issus du procédé, en particulier les esters de 3-monochloropropane-1,2-diol (3-MCPDE), dont la teneur est passée de 1,14 mg kg−¹ dans l’huile témoin à 2,72 mg kg−¹ dans l’huile raffinée contenant 10 % d’EFBO, tandis que la formation des esters de glycidol (GE) a été moins influencée par l’ajout d’EFBO. Lors du fractionnement à sec, les 3-MCPDE et les GE se sont révélés plus concentrés dans la fraction liquide (oléine) que dans la fraction solide (stéarine). L’étude conclut que le mélange d’EFBO avec la CPO peut dégrader la qualité et la sécurité de l’huile de palme brute, principalement en raison de l’augmentation de la formation de contaminants indésirables tels que les 3-MCPDE.
Key words: empty fruit bunch oil / glycidyl esters / 3-monochloropropane-1, 2-diol esters / refining
Mots clés : huile de rafles vides / esters de glycidol / esters de 3-monochloropropane-1, 2-diol / raffinage
Contribution to the Topical Issue: “Contaminants in oils and fats / Contaminants des huiles et corps gras”.
© M.R. Ramli et al., Published by EDP Sciences, 2026
 This is an Open Access article distributed under the terms of the Creative Commons Attribution License (https://creativecommons.org/licenses/by/4.0), which permits unrestricted use, distribution, and reproduction in any medium, provided the original work is properly cited.
Highlights
Blending empty fruit bunch oil (EFBO) with crude palm oil (CPO) reduces crude and refined oil quality due to its higher free fatty acid (FFA), diacylglycerol (DAG), total chloride and phosphorus contents. Increasing EFBO raises colour, FFA and 3-monochloropropane-1, 2-diol esters (3-MCPDE) levels, while glycidyl esters (GE) formation is minimally affected. Owing to its negative impact on quality and safety, EFBO is more suitable for non-edible uses such as biodiesel.
1 Introduction
The oil extraction rate (OER) of CPO in Malaysia has remained stagnant at between 19 and 21 % for the past 40 yr (Chew et al., 2021). The average OER recorded in 2022 and 2023 was 19.70 and 19.86 %, respectively (Ahmad Parveez et al., 2024). Several factors contribute to this stagnant OER, including inconsistent ripeness of fresh fruit bunches (FFB) delivered to the mills and inefficiencies in some older mills. To address these challenges, the Malaysian Palm Oil Board (MPOB) and palm oil mills have implemented various measures to improve OER, such as strengthening enforcement to ensure that only high-quality FFB are processed, particularly addressing the management of unripe and overripe FFB (MPOB, 2023). Additionally, mills using outdated system are encouraged to upgrade their machinery to improve efficiency. Palm oil mills are also urged to maximize oil recovery to further boost OER.
One strategy to increase OER involves recovering oil from EFB liquor and steriliser condensate. EFB naturally do not contain oil but over-steaming during sterilisation process can rupture oil-bearing cells in the fruit, causing oil to drip out and absorbed by the EFB. Proper control of sterilisation conditions can prevent this, eliminating the need for oil extraction from EFB. Nevertheless, utilising EFB liquor and steriliser condensate reduces the mill’s dependence on fresh water for oil dilution while improving OER. EFB has a high-water content, averaging around 60 % (w/w) (Cabrales et al., 2020). Many mills mechanically press EFB to recover residual oil and blend it with CPO, resulting in an OER increase of approximately 0.25 % (Chew et al., 2021). The amount of oil recovered depends on the type of steriliser used. Conventional sterilisers typically result in lower oil adsorption due to minimal stress on the FFB, whereas vertical sterilisers can cause significant oil adsorption in the EFB (Abd. Manaf et al., 2022).
The recovery and minimal blending of EFBO with CPO have proven effective in enhancing OER without compromising CPO quality. Palm oil millers consistently meet trading specifications for CPO, including a maximum FFA content of 5.0 %, a minimum deterioration of bleachability index (DOBI) value of 2.31, and a maximum moisture and impurities (M&I) content of 0.25 % (w/w). However, producing high-quality refined oil requires meeting additional quality parameters. The mechanical pressing of EFB may also extract impurities and unwanted compounds, such as phospholipids and chlorinated compounds. Studies have shown that solvent extracted pressed mesocarp fibre oil (PFO) contains higher levels of phospholipids (Nur Sulihatimarsyila et al., 2019; Nur Sulihatimarsyila et al., 2020; Hasliyanti et al., 2021), which can affect the bleachability and darkening of refined oil (Gibon et al., 2007; Chen and Sun, 2023). Moreover, chlorinated compounds are strongly correlated with the formation of 3-MCPDE (Tiong et al., 2018; Lakshmanan and Yung, 2021).
3-MCPDE and GE are found in abundance particularly in processed palm oil. The occurrence of 3-MCPDE in refined palm oil is primarily attributed to chloride content in CPO and exposure to high temperatures during the refining process. Studies show that chlorinated compounds in CPO acts as chlorine donors, promoting the formation of 3-MCPDE during deodorisation. The EFB liquor may contain higher levels of inorganic chloride due to its solubility in water and recycling EFB liquor could increase inorganic chloride content in CPO, subsequently elevating the formation of 3-MCPDE in refined palm oil if not being removed. On the other hand, GE is primarily formed in refined palm oil due to the inherently high levels of diacylglycerols (DAG), which undergo intramolecular elimination of a fatty acid to promote the formation (Han et al., 2021). The DAG content in EFBO may be higher than in CPO due to hydrolysis while blending EFBO with CPO could increase the DAG levels in the blended oil.
Both 3-MCPDE and GE are principally formed during refining and deodorisation steps. In the following fractionation stage, their distribution is influenced by factors such as the oil’s molecular composition and the temperature conditions involved. Studies indicate that 3-MCPDE and GE tend to concentrate more in the olein than in the stearin (Ramli et al., 2020). This is likely due to the solubility and the physical properties of these contaminants, which are more likely to remain in the liquid phase. Specifically, 3-MCPDE, being a chlorinated compound, tends to be more soluble in the oil phase, which explains its higher concentration in the olein. Similarly, GE, which forms from DAG, also remains predominantly in the olein because DAG is more soluble in the liquid fraction (Siew, 2002). The distribution of these contaminants can vary depending on the degree of fractionation and the specific conditions of the process, such as cooling rate. In general, the olein is more likely to retain higher levels of both 3-MCPDE and GE, which may pose concerns for the quality and safety of the final processed palm cooking oil.
The objective of this study was to examine the impact of blending EFBO with CPO on the refining process and the occurrence of process-developed contaminants in the processed palm oil. Additionally, the study investigated the partitioning of the contaminants during dry fractionation. Understanding the partitioning behaviour of these contaminants during dry fractionation is crucial for optimising palm oil processes and minimising the formation of undesirable compounds in the final oil. This work is among the first to provide integrated compositional, process, and contaminant data for EFBO-CPO blends under refining and dry fractionation conditions. The study highlighted the trade-off between enhancing OER and managing the quality and safety of the final product, particularly palm cooking oil. The findings from this work provided both scientific clarity and practical implications for the palm oil industry, especially in balancing oil yield optimisation with food safety and regulatory compliance. This research established new baseline knowledge for the treatment and valorisation of EFBO, supporting informed decisions on its possible applications in non-edible sectors.
2 Materials and methods
2.1 Materials
The CPO feedstock and EFB liquor were sampled from a palm oil mill in Selangor, Peninsular Malaysia. The liquor underwent centrifugation twice at 10,000 rpm using a Thermo Fisher Scientific Floor Model Centrifuge (Sorvall RC 5C+, Massachusetts, USA). The dual centrifugation steps aimed to remove water and sludge. After centrifugation, M&I content of the resulting EFBO was reduced to below 0.25 %. The EFBO was then blended with CPO at varying dosages of 0.1, 0.5, 1, 2.5, 5 and 10 % (w/w) before undergoing physical refining. CPO without any EFBO addition served as a control.
All chemicals (analytical and GC grades) and standards were purchased from Merck (Darmstadt, Germany) and Toronto Research Chemicals Inc. (TRC, Toronto, Canada), respectively. Ultra-pure water was obtained from a Millipore Milli-Q (Thermo Fisher Scientific, Massachusetts, USA).
Sulphuric acid-activated bleaching clay (Supreme 1B) used for refining process was sourced from Taiko Bleaching Earth Sdn. Bhd., while Whatman Filter Paper (No. 1 and 42) was procured from Merck (Darmstadt, Germany).
2.2 Methods
2.2.1 Glass refining
The refining process was conducted using a glass refining apparatus, equipped with an Edwards vacuum pump (RV3 ATEX, Burgess Hill, England) and a cold trap filled with liquid nitrogen to collect the FFA and other volatiles, as illustrated by Özdikicierler et al. (2016).
The CPO sample was first melted in an oven at 60 °C for 1 h. 200 g of the oil sample was weighed and transferred into a 250 ml round bottom flask. To degum the oil, 0.2 g H3PO4 (85 % concentration) was added and the mixture was allowed to react for 15 min at 85 °C. Subsequently, 2 g of bleaching clay was added to the degummed oil for bleaching process. Bleaching was carried out at 110 °C for 20 min with nitrogen blanketing. After bleaching, the spent clay was filtered from the oil using Whatman filter paper No. 1, with the assistance of the vacuum pump. The bleached oil was then deodorised in a three neck round bottom flask placed on a heating mantle (MTOPS DMS632, Kyounggi-do, Republic of Korea). The oil was heated to for 35 min and maintained at 260 °C for 90 min under a 1 mbar vacuum with steam sparging (Siew and Cheah, 2007). Once deodorisation was complete, the oil was cooled by a fan to room temperature (25 °C). The refined, bleached and deodorised palm oil (RBDPO) samples were collected and stored in a freezer at -20 °C prior to quality analysis.
2.2.2 Analyses of oil sample
2.2.2.1 Oil quality
Quality analyses of oil samples, including FFA, peroxide value (PV), p-anisidine value (AnV), iodine value (IV), DOBI, fatty acids composition (FAC), acylglycerol composition and colour were conducted following the Malaysian Palm Oil Board (MPOB) Test Methods (2005) and the American Oil Chemists Society (AOCS) Official Methods (1998).
2.2.2.2 Trace metals and phosphorus
Trace metals and phosphorus content were analysed according to the Association of Official Agricultural Chemists (AOAC) Official Method 984.27. 0.5 g oil sample was added to a mixture of 8 mL of HNO3 (65 % concentration) and 2 mL H2O2 (30 % concentration), then subjected to digestion using a Novawave Multiview (SCP Science, Quebec, Canada) equipped with a segmented rotor and 100 mL teflon-fluorinated microwave (TFM) vessel. The microwave digested protocol involved of a 15 min ramp to 180 °C, followed by a 15 min holding time at 180 °C. After cooling to room temperature (25 °C), the digested sample was filtered through Whatman No. 42 filter paper and diluted to 50 mL with an ultrapure water. The resulting solution was then analysed for trace metals and phosphorus content using Inductive Coupled Plasma Optical Emission Spectrometry (Agilent 5110 ICP-OES) (Agilent Technologies, Santa Clara, CA, USA).
2.2.2.3 Total chloride content
Total chloride content was analysed based on the American Society for Testing and Materials, ASTM D 4929 – 04 method B for crude oil, with slight modification. The analysis was conducted using the Total Chlorine Analyser (TCA) model NSX 2100 (Mitsubishi, Japan) as described by Abdul Hammid et al. (2022).
2.2.2.4 2-, 3-monochloropropane-1, 2-diol esters (3-MCPDE) and glycidyl esters (GE)
The 2- and 3-MCPDE, along with GE, were determined in accordance to AOCS Official Method Cd 29a-13: 2- and 3-MCPD fatty acid esters and glycidol fatty acid esters in edible oils and fats by acid transesterification. The method identifies the sum of derivatised 2-MCPD, 3-MCPD and 3-MBPD (converted from glycidyl esters) compounds using gas chromatography with mass spectrometry (GC-MS). Detection of the analyte was performed using an Agilent Technologies GC-MSD system (Santa Clara, CA, USA), equipped with a Series 5975C quadrupole detector and controlled by a programmable GC 7890A.
2.3 Statistical analysis
All experiments were conducted in duplicate, while sample analyses were performed in triplicate. The results were presented as means ± standard deviation (SD) of independent measurements. The data were subjected to one-way analysis of variance (One-way ANOVA) with Fisher’s Multiple Comparison to determine the significant differences among the samples, with a 95 % confidence interval (p < 0.05). Statistical analyses were conducted using Minitab software Version 16 (Minitab Inc., State College, PA, USA).
3 Results and discussion
3.1 Chemical properties of CPO, EFBO and the blends
The liquor obtained from the mechanical pressing of EFB was found to consist of 85 % water, 10 % sludge and 5 % (w/w) oil. The physicochemical properties of CPO, EFBO and the blends at different ratios are summarised in Table 1. EFBO contained significantly (p < 0.05) higher FFA and DAG contents, along with a very low DOBI value of 11.00 %, 8.35 % and 1.23, respectively. The elevated levels of FFA and DAG in EFBO are likely due to hydrolysis caused by exposure to water in the liquor. Despite the low DOBI of EFBO, the carotenes content did not significantly differ (p > 0.05) from CPO. Carotenes content is measured spectrophotometrically at 446 nm in a solution of oil dissolved in iso-octane, while DOBI is the ratio of spectrophotometric measurements at 446 and 269 nm. The 269 nm absorbance correlates with the oxidation level of the oil. Given that EFBO had almost comparable carotenes content of 680 mg kg−1 but a lower DOBI of 1.23 than CPO (690 mg kg−1 and 2.58, respectively), it can be postulated that, in addition to hydrolysis, EFBO was partially oxidised and may contain polar substances. A lower DOBI value will certainly affect the bleachability of the crude oil, requiring a higher dosage of bleaching earth during refining.
The DAG content in oil affects fractional crystallisation, which in turn influences olein yield. The effects of DAG on the crystallisation of palm products have been well-documented (Siew and Ng, 1996; Siew and Ng, 1999; Long et al., 2005; de Oliveira et al., 2014). More importantly, high DAG content is strongly correlated with the formation of GE in refined oil (Yung et al., 2023). The presence of 15.91 mg kg−1 chloride in EFBO is also concerning, as it contributes to the higher formation of 3-MCPDE (Tiong et al., 2018; Lakshmanan and Yung, 2021; Yung et al., 2023).
Table 1 also shows the phosphorus content of CPO, EFBO and the blends. The phosphorus content of 44.18 mg kg−1 in EFBO was significantly (p < 0.05) higher than CPO (17.05 mg kg−1). Phosphorus in oil measures the total phosphatides, which include phospholipids and some inorganic phosphates (Chen and Sun, 2023). Most of the phosphorus in palm oil exists as inorganic phosphate, with phospholipids making up 10 to 30 % (w/w) (Gibon et al., 2007). In CPO, the phosphorus is primarily from the non-hydratable phosphatides (NHP), which are removed during acid degumming and bleaching in the physical refining. The total phosphorus content in bleached palm oil (BPO) should be less than 5 mg kg−1 before deodorisation to ensure acceptable colour and stability of the refined oil (Gibon et al., 2007). Water degumming alone is insufficient to remove NHP, and thus cannot achieve the desired refined oil colour (Ramli et al., 2011). Zulkurnain et al. (2012) explored the relationship between phosphorus content in BPO and the occurrence of 3-MCPDE in RBDPO, suggesting that the effect of phospholipids on 3-MCPDE formation should be further studied.
Palm oil is known for having nearly equal amounts of saturated and unsaturated fatty acids. The fatty acids composition (FAC) of CPO and EFBO is nearly identical, except that EFBO contains slightly lower saturated fatty acids and slightly higher monounsaturated fatty acids (Tab. 2). As a result, EFBO exhibited a marginally higher IV of 53.49. Blends of up to 10 % (w/w) EFBO with CPO slightly altered the FAC, with a marginal increase in the IV of the oil blend. The FAC of EFBO was found to be closer to that of PFO. The PFO contained 41.22 % palmitic (C16:0) and 39.24 % oleic acid (C18:1), as reported by Hasliyanti et al. (2021).
The acylglycerol composition of CPO, EFBO and the blends is presented in Table 3. Compared to CPO, EFBO showed a lower content of triacylglycerol (TAG) groups, including triunsaturated (UUU), diunsaturated saturated (SUU), unsaturated disaturated (SSU) and trisaturated (SSS) TAG. This difference may be attributed to the hydrolysis of the oil, resulting in a higher level of partial glycerides and FFA in EFBO. Hydrolysis of the oil can occur in the presence of water and exposure of EFBO in the liquor led to an increased rate of oil hydrolysis, breaking down TAG into DAG, monoacylglycerols (MAG) and FFA. Consequently, the total TAG content of EFBO was lower than 90 %, while the DAG and FFA levels were higher.
Chemical properties of CPO, EFBO and the blends.
Fatty acids composition of CPO, EFBO and the blends.
Triacylglycerol and acylglycerol composition of CPO, EFBO and the blends.
3.2 Characteristics of the refined, bleached and deodorised palm oil (RBDPO)
The FFA content, colour and primary and secondary oxidation levels of RBDPO are shown in Figures 1 and 2. The blending of EFBO with CPO influenced the FFA content of RBDPO. Up to 1.0 % (w/w) EFBO addition to CPO did not result in a significant (p > 0.05) change in FFA content in the refined oil. However, as the EFBO concentration increased, the FFA levels in the refined oil gradually rose, reaching as high as 0.42 %. Figure 1 also indicates that higher percentages of EFBO in CPO significantly (p < 0.05) impacted the bleachability of the oil. RBDPO derived from CPO containing as much as 5 % (w/w) EFBO showed a marked increase in oil colour. The highest colour value of 2.5R was recorded in refined oil from CPO blended with 10 % (w/w) EFBO, while better colour of 1.0R was achieved when only 0.1 % EFBO blending was applied.
PV is the most common chemical method for measuring oxidative deterioration of oils. The PV reflects components produced during the early stages of oxidation, whereas AnV measures aldehyde and ketone breakdown products resulting from peroxides decomposition in the secondary oxidation phase (Majchrzak et al., 2018). In the initial stages of oxidation, the PV increases; as peroxides break down into aldehydes and ketones, the AnV rises, and eventually, the PV begins to decrease. Figure 2 shows the PV and AnV of RBDPO with varying EFBO dosages. It was found that the oxidative deterioration of RBDPO was significantly (p < 0.05) influenced by the EFBO levels. The contents of aldehydes and ketones also increased with higher EFBO concentrations, and these compounds were not adequately removed during the refining process.
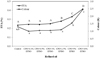 |
Fig. 1 Effect of EFBO on free fatty acids (FFA) content and colour of RBDPO. Results with different upper (A, B, C and D) and lower letters (a, b and c) are significantly different (p < 0.05) for FFA and colour, respectively. |
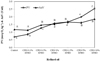 |
Fig. 2 Effect of EFBO on peroxide (PV) and p-anisidine value (AnV) of RBDPO. Results with different upper (A and B) and lower letters (a, b, c, d, e and f) are significantly different (p < 0.05) for AnV and PV, respectively. |
3.3 Formation of 3-MCPDE and GE during physical refining
The refined oils were also subjected to 3-MCPDE and GE analyses. In palm oil, the formation of these contaminants is primarily due to the presence of chlorinated compounds in CPO and the high temperatures applied during deodorisation. Figure 3 shows the levels of 2-, 3-MCPDE and GE in refined oils produced from CPO containing different proportions of EFBO prior to refining.
The levels of 2- and 3-MCPDE in refined oils increased with higher dosages of EFBO. The impact of EFBO on 3-MCPDE formation became evident when CPO was blended with 2.5 % (w/w) EFBO. At a 10 % (w/w) EFBO addition, the 3-MCPDE level reached its highest value of 2.73 mg kg−1 from 1.14 mg kg−1 in control oil, indicating more than two-fold increase in the contaminant formation. This effect of EFBO on 3-MCPDE formation can be attributed with the higher total chloride content in EFBO (Tab. 1). Two types of chlorinated compounds are present in CPO and contribute to 3-MCPDE formation; inorganic and organic chloride. Inorganic chlorides are water-soluble and can be easily removed through water washing before refining, as noted by Lakshmanan and Yung and (2021) and Ramli et al. (2020). Organochlorines, however, are more difficult to eliminate due to their insolubility in water.
In contrast to the 2- and 3-MCPDE levels, EFBO had no significant effect on GE formation. Even with 10 % (w/w) EFBO added to CPO, the refined oil exhibited a lower GE content of 2.10 mg kg−1 compared to the 5.32 mg kg−1 of control. It was discussed earlier that EFBO contains high levels of DAG, which could contribute to increased GE formation. However, the results did not support this, as the GE levels were relatively low, with the exception of the control oil. Although GE formation is generally more related to the DAG content in crude oil, the low GE levels observed in Figure 3 can be attributed to the thermal instability of GE. The structure of GE, which includes an epoxy group, makes it an unstable compound. Additionally, GE’s boiling point may be similar to that of MAG and it may be stripped off during deodorisation. This process requires a strong vacuum, typically not exceeding 1.0 mbar. In this study, the glass refining technique achieved a strong vacuum of below 1.0 mbar, which likely contributed to the removal of some GE during the experiments, thus explaining the low GE levels recorded in some of the refined oils.
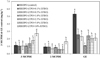 |
Fig. 3 MCPDE and GE in refined (RBD) oils with different percentages of EFBO. Results within columns with different letters are significantly different (p < 0.05). |
3.4 Partitioning of 3-MCPDE and GE in the fractionated products
As reported in the literature, 3-MCPDE and GE tend to partition more into the liquid fractions than into the solid fractions (Espinosa, 2017; Ramli et al., 2020). As a result, palm olein (POo) contains higher levels of 3-MCPDE and GE compared to palm stearin (PS) (Gibon et al., 2018; Kyselka et al., 2018; Ramli et al., 2020). A study by Ramli et al. (2020) demonstrated a significant (p < 0.05) increase of up to 20 % in 3-MCPDE in POo, while GE levels increased by up to 30 %. Espinosa (2017) also studied the dry fractionation of RBDPO and reported a 13 % enrichment of 3-MCPDE in POo. Further fractionation of POo resulted in a 32 % increase of 3-MCPDE in the higher IV super olein.
Figure 4 shows the distribution of 3-MCPDE and GE in POo and PS. Increments of 7 to 24 % for 3-MCPDE and 3 to 30 % for GE were observed in POo. Regardless of EFBO dosages, the levels of both 3-MCPDE and GE were higher in POo compared to RBDPO and PS. These findings are in consistent with those reported in the literature.
The higher concentrations of 3-MCPDE and GE observed in the liquid fractions after fractionation can be attributed to their polarity and molecular characteristics. During dry fractionation, the more saturated 3-MCPDE and GE forms, which are typically associated with higher-melting triglycerides, tend to crystallise in the solid fraction, whereas the more unsaturated forms, with lower melting points, remain in the liquid phase. Furthermore, the smaller carbon chain length and simpler molecular structure of 3-MCPDE and GE compared to triglycerides likely contribute to their overall lower melting behaviour, reinforcing their preferential retention in the liquid fraction. This segregation results in the esters being distributed between the liquid and solid phases (Gibon et al., 2018). Similarly, Kyselka et al. (2018) reported that during fractional crystallisation with acetone, segregation occurs due to the higher solubility of unsaturated fatty acids in the solvent.
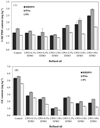 |
Fig. 4 Partitioning of 3-MCPDE (A) and GE (B) in olein (POo) and stearin (PS) upon dry fractionation of RBDPO. |
4 Conclusion
Most palm oil mills recover oil from EFB to enhance their OER. However, blending EFBO with CPO impacts both the quality of the CPO and the refined oil. EFBO contains higher levels of FFA, DAG, total chloride and phosphorus contents, all of which are associated with lower quality crude oil parameters. Although the carotenes content in EFBO and CPO is nearly identical, the EFBO has a lower DOBI value due to oxidation. During physical refining, EFBO significantly affects the bleachability of the blended oils. Both the colour and FFA content of RBDPO increased progressively relative to the control as the dosage of EFBO added to the CPO increased. Additionally, oxidation products, as measured by PV and AnV, showed an increase with higher EFBO levels. Pertaining to process-developed contaminants, the results indicated that EFBO significantly influenced 3-MCPDE formation, although the effect on GE was minimal. During dry fractionation of RBDPO, both 3-MCPDE and GE partitioned more into the olein fraction, likely due to the polarity differences and selective co-crystallisation behaviour of the contaminants, which favours the more polar olein. Given the negative impact of EFBO on the quality of both crude (DOBI value, FFA, DAG, phosphorus and total chloride contents) and refined oils (3-MCPDE content), it is recommended that this secondary oil be utilised for non-edible purposes, such as biodiesel production. While EFBO appears unsuitable for edible oil, future effort should focus on its economic viability and environmental impact when diverted to biodiesel production. Additionally, other industrial uses should be assessed through techno-economic and life cycle analyses (LCA).
Acknowledgments
The research team would like to express their sincere gratitude to the Director-General of MPOB for granting permission to conduct this research project. Support from the Director of Product Development and Advisory Services Division is highly appreciated. Special gratitude is also extended to the supporting staff of Food Safety Group (FSG) for their invaluable contributions and assistance. Additionally, financial support by MPOB to carry out this study is also greatly appreciated.
Conflicts of interest
The authors declare that they have no conflicts of interest in relation to this article.
References
- Abdul Hammid AN, Ahmad Tarmizi AH, Ramli MR, Kuntom A, Lee HC. 2022. Method for the determination of total chloride content in edible oils. J Oil Palm Res 34: 710–720. [Google Scholar]
- Manaf FY Abd., Halim R Mohd., Andrew Yap KC, Hawari Y. 2023. Effect of palm oil sterilisation technology on aqueous co-products characteristics. J Oil Palm Res 35: 247–255. [Google Scholar]
- Ahmad Parveez GK, Loew SS, Kamil NN, et al. 2024. Oil palm economic performance in Malaysia and R&D progress in 2023. J Oil Palm Res 36: 171–186. [Google Scholar]
- AOCS. 1998. Official methods and recommended practices of the American Oil Chemists’ Society, 5th edn., Champaign, IL. [Google Scholar]
- ASTM D4929-04. 2004. Standard test methods for determination of organic chloride content in crude oil. West Conshohocken, PA: ASTM International. [Google Scholar]
- Cabrales H, Arzola N, Araque O. 2020. The effects of moisture content, fiber length and compaction time on African oil palm empty fruit bunches briquette quality parameters. Heliyon 6: e05607. [Google Scholar]
- Chen X, Sun S. 2023. Color reversion of refined vegetable oils: a review. Molecules 28: 5177. [Google Scholar]
- Chew CL, Ng CY, Hong WO, et al. 2021. Improving sustainability of palm oil production by increasing extraction rate: a review. Food Bioprocess Technol 14: 573–586. [Google Scholar]
- de Oliveira IF, Grimaldi R, Goncalves LAG. 2014. Effects of diacylglycerols on crystallization of palm oil (Elaeis guineensis). Eur J Lipid Sci Technol 116: 904–909. [Google Scholar]
- Espinosa L. 2017. Mitigating 3-MCPD- and glycidyl esters at the refineries. Paper presented at 17th AOCS Latin America Congress. Cancun, Mexico. 11-14 September 2017. [Google Scholar]
- Gibon V, De Greyt W, Kellens M. 2018. Oil modification: solution or problem for 3-monochloro-1, 2-propanediol (3-MCPD) and glycidyl esters (GE) mitigation? INFORM 29: 14–19. [Google Scholar]
- Gibon V, De Greyt W, Kellens M. 2007. Palm oil refining. Eur J Lipid Sci Technol 109: 315–335. [Google Scholar]
- Han L, Li J, Wang S, et al. 2021. Sesame oil inhibits the formation of glycidyl ester during deodorization. Int J Food Prop 24: 505–516. [Google Scholar]
- Hasliyanti A, Ng MH, Jalani NF, Rohaya MH. 2021. Palm pressed fibre oil recycling: its implication on CPO quality. Palm Oil Eng Bull 138: 29–37. [Google Scholar]
- Hasliyanti A, Rusnani AM, Wan Hasamudin WH, Ng MH, Nor Faizah J, Rohaya MH. 2021. The effects of recycling palm pressed-fibre oil on crude palm oil quality. J Oil Palm Res 34: 79–91. [Google Scholar]
- Kyselka J, Matějková K, Šmidrkal J, et al. 2018. Elimination of 3-MCPD fatty acid esters and glycidyl esters during palm oil hydrogenation and wet fractionation. Eur Food Res Technol 244: 1887–1895. [Google Scholar]
- Lakshmanan S, Yung YL. 2021. Chloride reduction by water washing of crude palm oil to assist in 3-monochloropropane-1, 2 diol ester (3-MCPDE) mitigation. Food Addit Contam: Part A 38: 371–387. [Google Scholar]
- Long K, Jamari MA, Ishak A, et al. 2005. Physico-chemical properties of palm olein fractions as a function of diglyceride content in the starting material. Eur J Lipid Sci Technol 107: 754–761. [Google Scholar]
- Majchrzak T, Wojnowski W, Dymerski T, Gebicki J, Namiesnik J. 2018. Electronic noses in classification and quality control of edible oils: a review. Food Chem 246: 192–201. [Google Scholar]
- MPOB Pekeliling Penguatkuasaan (Pelesenan). 2023. Penguatkuasaan Penggunaan Garis Panduan Amalan Perniagaan Buah Kelapa Sawit (Edisi Kedua) Sebagai Syarat Lesen Kategori Peniaga Buah Kelapa Sawit (DF) dan Kilang Buah Kelapa Sawit (MF), Pk (EL) MPOB 01/2023. Malaysian Palm Oil Board, Kuala Lumpur. [Google Scholar]
- MPOB Test Method. 2004. A compendium of test on palm oil products, palm kernel products, fatty acids, food related products and others, Malaysian Palm Oil Board, Kuala Lumpur. [Google Scholar]
- Nur Sulihatimarsyila AW, Harrison LLN, Nabilah KM, Nur Azreena I. 2020. Production of refined red palm-pressed fibre oil from physical refining pilot plant. Case Stud Chem Environ Eng 2: 100035. [Google Scholar]
- Nur Sulihatimarsyila AW, Harrison LLN, Nabilah KM, Nur Azreena I. 2019. Refining process for production of refined palm-pressed fibre oil. Ind Crop Prod 129: 488–494. [Google Scholar]
- Official Methods of Analysis of AOAC International. 2012. 19th Ed., AOAC International, Rockville, MD, USA. [Google Scholar]
- Özdikicierler O, Yemişcioğlu F, Gűműşkesen AS. 2016. Effects of process parameters on 3-MCPD and glycidyl ester formation during steam distillation of olive oil and olive pomace oil. Eur Food Res Technol 242: 805–813. [Google Scholar]
- Ramli MR, Ahmad Tarmizi AH, Abdul Hammid AN, et al. 2020. Preliminary large scale mitigation of 3-monochloropropane-1, 2-diol (3-MCPD) esters and glycidyl esters in palm oil. J Oleo Sci 69: 815–824. [Google Scholar]
- Ramli MR, Siew WL, Ibrahim NA, et al. 2011. Effects of degumming and bleaching on 3-MCPD esters formation during physical refining. J Am Oil Chem Soc 88: 1839–1844. [Google Scholar]
- Siew WL. Palm oil. In: Gunstone FD, ed. Vegetable oils in food technology: composition, properties and uses (2nd ed.). Oxford, UK: Wiley, 2002, pp. 59–97. [Google Scholar]
- Siew WL, Cheah KY. 2007. Optimization of degumming with attapulgite and acid-activated clays in refining palm oil. J Oil Palm Res 19: 373–380. [Google Scholar]
- Siew WL, Ng WL. 1996. Effect of diglycerides on the crystallisation of palm oleins. J Sci Food Agric 71: 496–500. [Google Scholar]
- Siew WL, Ng WL. 1999. Influence of diglycerides on crystallisation of palm oil. J Sci Food Agric 79: 722–726. [Google Scholar]
- Tiong SH, Saparin N, Teh HF, et al. 2018. Natural organochlorines as precursors of 3-monochloropropanediol esters in vegetable oils. J Agric Food Chem 66: 999–1007. [Google Scholar]
- Yung YL, Laksmanan S, Kumaresan S, Chu CM, Tham HJ. 2023. Mitigation of 3-monochloropropane 1,2 diol ester and glycidyl ester in refined oil – a review. Food Chem 429: 136913. [Google Scholar]
- Zulkurnain M, Lai OM, Abdul Latip R, Nehdi IA, Ling TC, Tan CP. 2012. The effects of physical refining on the formation of 3-monochloropropane-1, 2-diol esters in relation to palm oil minor components. Food Chem 135: 799–805. [Google Scholar]
Cite this article as: Ramli M. R, Tarmizi A.H.A, Hammid A.N.A, Razak A.A. 2026. Influence of empty fruit bunch oil on crude palm oil quality and refining characteristics. OCL 33: 16. https://doi.org/10.1051/ocl/2026009
All Tables
All Figures
|
Fig. 1 Effect of EFBO on free fatty acids (FFA) content and colour of RBDPO. Results with different upper (A, B, C and D) and lower letters (a, b and c) are significantly different (p < 0.05) for FFA and colour, respectively. |
| In the text | |
|
Fig. 2 Effect of EFBO on peroxide (PV) and p-anisidine value (AnV) of RBDPO. Results with different upper (A and B) and lower letters (a, b, c, d, e and f) are significantly different (p < 0.05) for AnV and PV, respectively. |
| In the text | |
|
Fig. 3 MCPDE and GE in refined (RBD) oils with different percentages of EFBO. Results within columns with different letters are significantly different (p < 0.05). |
| In the text | |
|
Fig. 4 Partitioning of 3-MCPDE (A) and GE (B) in olein (POo) and stearin (PS) upon dry fractionation of RBDPO. |
| In the text | |
Current usage metrics show cumulative count of Article Views (full-text article views including HTML views, PDF and ePub downloads, according to the available data) and Abstracts Views on Vision4Press platform.
Data correspond to usage on the plateform after 2015. The current usage metrics is available 48-96 hours after online publication and is updated daily on week days.
Initial download of the metrics may take a while.