")
")
| Issue |
OCL
Volume 33, 2026
Adapting to climate change / Adaptation au changement climatique
|
|
|---|---|---|
| Article Number | 17 | |
| Number of page(s) | 15 | |
| DOI | https://doi.org/10.1051/ocl/2026008 | |
| Published online | 21 April 2026 | |
Research article
Critical fruit developmental periods influencing oil quality in olive (cv. Arbequina) under reduced solar radiation☆
Périodes critiques du développement du fruit influençant la qualité de l’huile d’olive (cv. Arbequina) sous réduction du rayonnement solaire
* Corresponding author: This email address is being protected from spambots. You need JavaScript enabled to view it.
; This email address is being protected from spambots. You need JavaScript enabled to view it.
Received:
22
October
2025
Accepted:
19
February
2026
Abstract
The global expansion of olive cultivation has led to the widespread adoption of highly mechanized production systems, with the Arbequina cultivar emerging as a dominant choice due to its high productivity and adaptability. Given that the physicochemical quality of its oil is highly sensitive to environmental conditions, understanding the impact of abiotic stress on olive oil quality during key fruit developmental stages is essential for adapting orchard management to climate variability. In this context, the aim of this study was to identify and characterize the critical periods of fruit development that determine the physicochemical quality, fatty acid composition, and phenolic profile of ‘Arbequina’ olive oil under conditions of reduced solar radiation. To this end, whole olive trees were subjected, to intense shading (80%) during 30-day periods, using chambers. The results revealed that oil composition, particularly oleic acid content, and extinction coefficients are significantly influenced by the timing of stress exposure. Besides, two key accumulation phases of the principal fatty acid, cis-oleic acid were identified: an early phase (30–60 days after full bloom, DAFB) marked by increased content, and a later phase (120 DAFB) showing a pronounced decline. These changes were inversely correlated with palmitic acid levels. Linoleic acid levels decreased significantly during the 30–60 DAFB, while linolenic acid levels declined between full bloom and 30 DAFB, followed by an increase after 90 DAFB. Regarding phenolic compounds, oleacein and oleocanthal levels decreased significantly under stress, whereas hydroxytyrosol and luteolin remained stable, indicating selective metabolic responses. Given the global expansion of olive cultivation in semi-arid regions, these findings provide a framework to mitigate climate-induced quality losses in a wide variety of emerging production areas. By identifying stress-sensitive developmental stages, this study offers actionable insights to preserve EVOO quality and optimize harvest and canopy management.
Résumé
L’expansion mondiale de la culture de l’olivier a conduit à l’adoption généralisée de systèmes de production hautement mécanisés, la variété Arbequina s’imposant comme un choix dominant en raison de sa forte productivité et de son adaptabilité. Étant donné que la qualité physicochimique de son huile est très sensible aux conditions environnementales, il est essentiel de comprendre l’impact des stress abiotiques sur la qualité de l’huile d’olive durant les principales phases de développement du fruit afin d’adapter la gestion des vergers à la variabilité climatique. Dans ce contexte, l’objectif de cette étude était d’identifier et de caractériser les périodes critiques du développement du fruit qui déterminent la qualité physicochimique, la composition en acides gras et le profil phénolique de l’huile d’olive ‘Arbequina’ dans des conditions de rayonnement solaire réduit. À cette fin, des oliviers entiers ont été soumis à un ombrage intense (80 %) pendant des périodes de 30 jours, à l’aide de chambres.
Les résultats ont révélé que la composition de l’huile, en particulier la teneur en acide oléique, ainsi que les coefficients d’extinction, est significativement influencée par le moment d’exposition au stress. Par ailleurs, deux phases clés d’accumulation du principal acide gras, l’acide oléique cis, ont été identifiées : une phase précoce (30–60 jours après la pleine floraison, DAFB) caractérisée par une augmentation de la teneur, et une phase plus tardive (120 DAFB) marquée par un déclin prononcé. Ces variations étaient inversement corrélées aux niveaux d’acide palmitique. Les niveaux d’acide linoléique ont diminué significativement entre 30 et 60 DAFB, tandis que ceux d’acide linolénique ont diminué entre la pleine floraison et 30 DAFB, avant d’augmenter après 90 DAFB. Concernant les composés phénoliques, les teneurs en oléacéine et en oléocanthal ont diminué significativement sous stress, alors que l’hydroxytyrosol et la lutéoline sont restés stables, indiquant des réponses métaboliques sélectives. Compte tenu de l’expansion mondiale de la culture de l’olivier dans les régions semi-arides, ces résultats fournissent un cadre permettant d’atténuer les pertes de qualité induites par le climat dans un large éventail de zones de production émergentes. En identifiant les stades de développement sensibles au stress, cette étude apporte des éléments concrets pour préserver la qualité de l’huile d’olive vierge extra (EVOO) et optimiser la gestion de la récolte et de la canopée.
Key words: Critical stages / shading stress / fatty acid composition / phenolic compounds / oil quality parameters
Mots clés : Stades critiques / stress d’ombrage / composition en acides gras / composés phénoliques / paramètres de qualité de l’huile
Contribution to the Topical Issue: “Adapting to climate change / Adaptation au changement climatique”.
© A. Banco et al., Published by EDP Sciences, 2026
 This is an Open Access article distributed under the terms of the Creative Commons Attribution License (https://creativecommons.org/licenses/by/4.0), which permits unrestricted use, distribution, and reproduction in any medium, provided the original work is properly cited.
Highlights
Shading at key stages affected olive fruit and oil quality traits.
The period from full bloom until 60 days after full bloom was critical for phenolic and flavonoid biosynthesis.
Shading reduced oleacein and oleocanthal contents in olive oil.
Stress increased oxidative markers, threatening EVOO stability.
1 Introduction
Global olive production has expanded significantly over the past three decades (International Olive Council, 2023). Modern orchards are increasingly designed to enable mechanisation of traditionally labour-intensive tasks, particularly harvesting and pruning. Full mechanization reduces costs, labour demands and also more timely and efficient orchard management (Trentacoste et al., 2015). Argentina is currently the largest olive producer outside the Mediterranean region, with approximately 77,000 hectares of olive groves. About 70% of this production is dedicated to olive oil, with an annual industrial output of approximately 33,000 to 40,000 metric tons, while the remaining 30% is for table olives. ‘Arbequina’ is the dominant cultivar, representing over 50% of total plantings due to its suitability for super-high-density mechanized orchards (Gómez-del-Campo and García, 2012; Vita Serman et al., 2021). Its adoption stems from agronomic advantages, including high productivity, low alternate bearing, early onset of fruiting, and cold tolerance (Sánchez and Trentacoste, 2020). However, ‘Arbequina’ oils typically show lower bitterness, pungency, and fruitiness, associated with reduced oleic acid, phenolics and oxidative stability (Gómez-del-Campo and García, 2012)
Global consumption of extra virgin olive oil (EVOO) continues to rise, due to its nutraceutical properties, (Lozano-Castellón et al., 2020). EVOO quality is shaped by environment and cultivar, particularly regarding phenolic and fatty acid profiles (García-Inza et al., 2014; Rondanini et al., 2014). To qualify as extra virgin, olive oil must come from sound fruit and be extracted exclusively through physical and thermal processes preserving its quality (International Olive Council, 2022). These standards allow EVOO to retain its terroir attributes, unlike seed oils extracted via invasive methods. Thus, environmental changes during fruit development directly influence oil composition (Rondanini et al., 2014; Hamze et al., 2022).
EVOO’s nutraceutical value is attributed primarily to its high oleic acid content (Leporini et al., 2018). However, comparative metabolic studies involving patients who consumed either EVOO or high oleic sunflower oil (HOSO) showed better outcomes for EVOO consumers (Soriguer et al., 2013). These findings have led to the recognition of phenolic compounds as additional key antioxidant contributors (Aguilera et al., 2004). The physicochemical properties of olive oil, particularly its fatty acid and phenolic composition, are strongly influenced by both biotic and abiotic stress factors (Araújo et al., 2021).
Olive fruit develops over six to seven months, during which both leaves and fruits face considerable environmental variability. Numerous studies have shown that oil’s fatty acid and phenolic profiles depend on genotype (Aguilera et al., 2005; Banco et al., 2022), air temperature (Rondanini et al., 2011; García-Inza et al., 2014), solar radiation (Hernández et al., 2011; Gómez-del-Campo and García, 2012; Cherbiy-Hoffmann et al., 2013), crop management (Tovar et al., 2002; Dag et al., 2008), and their interactions among these factors. Today, one of the most pressing challenges facing agriculture is climate change, which encompasses global warming, increased frequency of droughts and floods, and more extreme temperature fluctuations (Fraga et al., 2020). Though olive trees are known for resilience under drought (Brito et al., 2019) and extreme temperatures (Sánchez and Trentacoste, 2020; Miserere et al., 2021), these environmental stresses are becoming increasingly unpredictable (Fraga et al., 2020). In this context, optimizing management, via improved or new strategies, is essential to reduce productivity and quality losses. A key challenge is identifying when the crop is most vulnerable to stress.
Numerous studies in olive have highlighted the role of radiation in carbon metabolism and its influence on phenolic synthesis (Matsuki, 1996), fatty acid composition, free acidity, peroxide index and extinction coefficients (Lémole et al., 2018). Recently, the effects of abiotic stress on olive oil quality have been extensively studied (Patumi et al., 2002; Greven et al., 2009; García-Inza et al., 2014; Nissim et al., 2020). In particular, studies evaluating artificial shading and fruit canopy position have demonstrated significant effects on fatty acid composition, especially on oleic acid concentration (Cherbiy-Hoffmann et al., 2013; Cherbiy-Hoffmann et al., 2015; Rousseaux et al., 2020). However, the extent to which the timing of stress during specific phases of fruit development influences oil composition remains poorly understood. The key developmental windows determining these traits are still largely unexplored.
To investigate these critical periods, mature olive trees were subjected to intense shading treatments over short, defined intervals. This technique, previously applied in olive (Lémole et al., 2018; Trentacoste et al., 2022) as well as in various grain crops such as chia (Diez et al., 2021), sunflower (Castillo et al., 2017), maize (Cerrudo et al., 2013), broad bean (Lake et al., 2019), and chickpea (Lake and Sadras, 2014), enables the controlled reduction of irradiance, thereby decreasing photosynthesis. This response effectively simulates physiological effects associated with both biotic and abiotic stressors, including water deficit, temperature fluctuations, and pest-induced defoliation (Araújo et al., 2021; Bianchetti et al., 2024).
While previous studies have explored the impact of abiotic stress on olive physiology, few have identified critical developmental windows during which stress exerts the greatest influence on oil composition. In this study, we examine the temporal sensitivity of fruit development in cv. Arbequina to reduced solar radiation during specific developmental stages, with the aim of establishing a predictive framework for quality management under variable environmental conditions. This is achieved by assessing the impact of light stress on the physicochemical properties, fatty acid composition, and phenolic profile of ‘Arbequina’ olive oil.
2 Material and methods
2.1 Plant material and location
The experiment was conducted over three consecutive growing seasons (2017–2018, 2018–2019 and 2019–2020) in an Arbequina olive orchard located at the Junín Experimental Station, INTA, Mendoza, Argentina (33°06′S, 68°29′W, 653 m.a.s.l.). Established in 2008, the orchard has north–south hedgerows spaced 7 × 3 m (476 trees ha⁻¹). Drip irrigation (2.0 L h⁻¹ emitters every 0.8 m, double line) supplied 100% of crop evapotranspiration (ETc) during the season. Soil is clay-loam. The arid climate has an average annual rainfall of 262.6 mm (1991–2020), mostly in summer, and a mean temperature of 15.6 °C. The frost-free period lasts ∼180 days, October to March.
2.1.1 Treatments
For the experiment, three trees (replicates) per treatment were selected and enclosed in intensive shading chambers for a period of 30 days. Each chamber consisted of a metal frame measuring 3 m in width, 2 m in length, and 4 m in height, covered with a high-density grey shade mesh that reduced incident solar radiation by approximately 80%. To ensure adequate ventilation, the mesh was elevated approximately 50 cm above ground level (Fig. 1). Six treatments were implemented, spanning from full bloom (early November) to harvest (mid-April). The treatments were defined as follows: control (no shading), full bloom (FB), 30 days after full bloom (30 DAFB), 60 days after full bloom (60 DAFB), 90 days after full bloom (90 DAFB), and 120 days after full bloom (120 DAFB). Control trees were exposed to natural solar radiation throughout the entire experimental period. To determine full bloom, reproductive phenological stages were monitored daily (from October to mid-November) through visual assessment of the experimental orchard, following the BBCH numerical scale as described by Sanz-Cortés et al. (2002). In each season, plants reached stage BBCH 65 (Fig. 2) on 5 November 2017, 3 November 2018 and 4 November 2019.
On these dates, shading chambers were installed over the trees designated for the FB treatment, marking the start of the treatment period. After 30 days, the chambers were relocated to initiate the next treatment phase. This sequence was repeated successively for each remaining treatment.
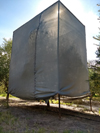 |
Fig. 1 Photo of one of the chambers used during assay. |
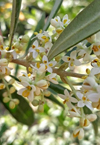 |
Fig. 2 Photo of an inflorescence in full bloom used as a reference to determine the stage BBCH65. |
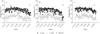 |
Fig. 3 Maximum and minimum temperatures recorded outside the shading chambers during the three seasons (A) 2017–2018 (B) 2018–2019 (C) 2019–2020. Harvest dates for each season are also indicated. |
2.2 Radiation and temperature
During the 2019–2020 season, radiation inside and outside the shading chambers was characterized through direct measurements using a pyranometer (SKYE SpectroSense 2). Fortnightly measurements of horizontally incident photosynthetically active radiation (PAR) were taken both inside and outside the chambers during solar noon (12:00–14:00 h) under completely clear sky conditions. Outside radiation was measured at three positions above the chamber roof, with the sensor head positioned horizontally for each replicate. Inside the chamber, measurements were taken at three canopy positions with the sensor head positioned horizontally at a height of 1.3 m.
Additionally, these measurements were used to confirm the percentage reduction of incident radiation on the plants caused by the chamber’s shade mesh. This estimation was further supported by a model developed by Connor et al. (2016), which calculates horizontally incident PAR under clear-sky conditions by incorporating parameters such as row spacing and orientation, canopy height and width, horizontal porosity, latitude and day of the year.
Temperature inside the chambers was recorded using a thermal sensor (HOBO U12) installed within the tree canopy at a height of 1.3 m. The sensor was shielded from direct solar radiation and rain by a protective cover. To prevent overheating, the shade mesh was raised approximately 50 cm above the ground (Fig. 1). The sensor logged temperature data every 30 min from 4 to 14 November 2019. Outside-chamber temperature was recorded at a nearby meteorological station throughout the 2017–2018, 2018–2019, and 2019–2020 seasons. The HOBO data logger was calibrated prior to deployment, and its data were correlated with the meteorological station’s readings (R2 = 0.94) to evaluate temperature differences between inside and outside the chambers across a broad temperature range (data not shown).
2.3 Stomatal conductance, leaf temperature and stem water potential
The general physiological status of the plants was assessed by measuring stomatal conductance, leaf temperature, and stem water potential. Stomatal conductance and leaf temperature were recorded using a calibrated porometer (SC-1 Leaf Porometer, METER Group, Inc., Decagon Devices). For each measurement, two fully developed leaves located in the middle section of a one-year-old branch were selected. Data were collected approximately every 15 days between 10:00 and 12:00 h under clear sky conditions.
Stem water potential was measured on fully developed leaves taken from the mid-zone of actively growing shoots, positioned in the lower part of the plant and shaded from direct sunlight. To allow equilibration between leaf and stem, selected leaves for water potential measurements were enclosed in aluminum foil bags at least 1 h before measurement. Measurements were conducted using a pressure chamber Scholander, BioControl, Buenos Aires, Argentina under completely clear sky conditions at solar noon (12:00–14:00 h) on six dates: 8, 30, 85, 100, 133, and 160 days after full bloom (DAFB). All replicates were included during the 2019–2020 growing season.
2.4 Fruit harvest and oil extraction
The three trees (replicates) from each treatment were hand-harvested. A 20 kg fruit sample from each tree was transported to the processing facility for olive oil extraction. Briefly, the olives were crushed using a hammer mill in a continuous system with a 20 kg capacity (Alfa-Laval SPREMOLIVE NEW Single Phase. MF-Toscana Enologica Mori-Italy). The resulting paste was then kneaded in a two-phase decanter at 25 °C for 30 min. After extraction, the olive oil was filtered and aliquoted into 30 mL amber vials, which were stored at −20 °C in darkness until analysis.
2.5 Determination of free acidity, peroxide index and extinction coefficients (K232 and K270) determination
To evaluate the physicochemical quality of the oils, standard analyses were performed on each sample according to the methodologies outlined by the International Olive Council (International Olive Council, 2022). Free acidity was determined by titration with a sodium hydroxide solution (COI/T.20/Doc.n° 34) and expressed as a percentage of oleic acid. Peroxide value was measured as milliequivalents of active oxygen per kilogram of oil, based on the oxidation of potassium iodide (COI/T.20/Doc.n° 35). Extinction coefficients (K232 and K270) were calculated from the absorbance of a 0.25 g oil solution in 25 mL of n-hexane, measured at 232 nm and 270 nm using a UV-Vis spectrophotometer (COI/T. 20/Doc.n° 19).
2.6 Determination of total phenolic and flavonoid content
For the extraction of total phenolic and flavonoid content, 6 g of olive oil was mixed with 3 mL of an 80:20 (v/v) methanol/water solution. The mixture was centrifuged at 4000 rpm for 20 min, and the supernatant was collected. This extraction was repeated twice more on the same 6 g of olive oil, and the supernatants were combined and homogenized prior to analysis.
Both total phenolic and flavonoid contents were determined using a modified method based on Jemai et al. (2009). Total phenolic content was measured by the Folin-Ciocalteu colorimetric assay. Briefly, 200 μL of the extracted sample was mixed with 1800 μL of distilled water, followed by the addition of 10 mL of 10% Folin-Ciocalteu reagent and 8 mL of sodium carbonate solution (75 g/L). After incubation for 2 h in darkness, absorbance was measured at 725 nm using a UV-Vis spectrophotometer (Biotraza Model 752, China) against a blank. Analyses were performed in triplicate, and results were expressed as pyrogallol equivalents on a dry weight basis (Monasterio et al., 2021), calculated from a calibration curve (y = 0.0014x + 0.0197, R2 = 0.9954) prepared with pyrogallol standards ranging from 50 to 1500 mg/L. Total flavonoid content was determined in triplicate by mixing 1 mL of the extracted sample with 4 mL of distilled water, in a 10 mL volumetric flask. Then, 0.3 mL of 5% sodium nitrite was added. After 5 min, 0.3 mL of 10% aluminum chloride was introduced, and 6 min later, 2 mL of 1M sodium hydroxide was added. Absorbance was read at 510 nm against a blank. Results were expressed as pyrocatechol equivalents, on a dry weight basis (Monasterio et al., 2021), based on a calibration curve (y = 0.0073x + 0.084 R2 = 0.9927) prepared with pyrocatechol standards ranging from10 to 250 mg/L.
2.7 Determination of phenolic compound profile
The samples for phenolic profile analysis were stored at −20 °C until extraction, to minimize phenol degradation. Extraction followed the International Olive Council protocol (2022). Briefly, 5 g of olive oil was mixed with 5 mL of an 80:20 (v/v) methanol/water solution, prepared with absolute methanol (J.T.Baker Avantor, CAS N°:67-56-1). The mixture was stirred for 30 min, then centrifuged at 4000 rpm for 20 min. The supernatant was collected, and the extraction was repeated three times on the same sample.
Individual soluble phenols were measured at the Laboratorio de Calidad de Aceite INTA EEA San Juan using high-performance liquid chromatography (HPLC-DAD Shimadzu Prominence LC with a Teknokroma®, Mediterranea Sea C18 column (5 μm particle size, 250 × 4.6 mm i.d.). The analysis ran at room temperature with a 1.0 mL/min flow rate. The mobile phase consisted of ultrapure water (phase A) and acetonitrile 99.8% (Sigma Aldrich, SKU 151807, CAS n° 2206-26-0) as phase B, following a 55 min gradient: starting at 95% A - 5% B; decreasing to 75% A - 25% B at 30 min; 50% A - 50% B at 45 min; 0% A - 100% B at 47 min; shifting back to 75% A - 25% B at 50 min; and returning to 95% A - 5% B at 52 min, maintained until the run ended.
Chromatograms were analyzed by peak integration at 280 nm, calibrated against an external hydroxytyrosol standard (98%, Sigma Aldrich, SKU H4291-25MG, CAS No 10597-60-1). The calibration curve had a detection limit of 0.168 mg/L, quantification limit of 0.452 mg/L, and linear range from 0 to 1000 mg/L. Results were expressed in mg/L. Other phenolic compounds (coumaric acid, oleacein, oleocanthal and luteolin) were identified by retention times (RT: 27.18, 29.9, 36.92 and 42.46 min, respectively) and confirmed by reference spectra. Since pure analytical standards were not available for most of the identified phenolic compounds, absolute quantification in terms of concentration was not feasible. Therefore, peak areas were normalized relative to the control treatment and expressed as dimensionless values. This approach allows for robust comparison of relative changes among treatments and developmental stages, which is the primary objective of this study. This semi-quantitative approach is commonly used in phenolic profiling studies when standards are unavailable and is suitable for assessing treatment-induced variation (Mradu et al., 2012).
2.8 Fatty acid composition
Olive oil fatty acid profile was determined at the Laboratorio de Alta Complejidad, Universidad Nacional de Chilecito, following the International Olive Council method (IOC/T.20/Doc N°33 /Rev.1 /2017). Briefly, 0.1 g of oil was mixed with 2 mL of heptane and vortexed for 10 s. Then, 0.2 mL of 2N methanolic potassium hydroxide solution was added and vortexed again for 10 s. The mixture was centrifuged at 10,000 g for 5 min, and the supernatant was transferred to a chromatographic vial. A 1 μL aliquot of the resulting fatty acid methyl esters was injected into a Shimadzu GC2010 Plus gas chromatograph equipped with a flame ionization detector (FID) and a Phenomenex ZB–FAME column (60 m x 0.25 mm x 0.2 μm). Hydrogen was used as the carrier gas at 1.2 mL/min. Detector and injector temperatures were set to 260 °C and 240 °C, respectively, with a split ratio of 1:10. Results were expressed as the relative proportion of the total fatty acid methyl ester area.
Ratios between individual fatty acids and fatty acid groups were also calculated. Total saturated fatty acids (∑SFA) included palmitic, margaric, stearic, arachidonic, behenic and lignoceric acids. Total unsaturated fatty acids (∑UFA) comprised palmitoleic, margaroleic, cis-oleic, trans-oleic, linoleic, linolenic and eicosanoic acids. Total monounsaturated fatty acids (∑MUFA) included palmitoleic, margaroleic, cis-oleic, trans-oleic and eicosanoic acids. Total polyunsaturated fatty acids (∑PUFA) consisted of linoleic and linolenic acids.
2.9 Statistical analysis
A completely randomized experimental design was employed for the assay, with three replicates (trees) per treatment (n = 3). Oil parameters were analysed using analysis of variance (ANOVA). Mean comparisons were performed with the DGC multiple comparison test at a significance level of α = 0.05. This test reduces the number of significant differences and while improving the clarity of distinctions between means when possible. Multivariate statistical analyses were performed to explore the relationships among the measured variables and to identify the main sources of variation within the dataset. Principal Component Analysis (PCA) was applied as an ordination technique to reduce data dimensionality and to summarize the main sources of variance in the dataset, allowing visualization of treatment grouping and variable associations. Graphs were created using Excel, InfoStat and GraphPad Prism version 5.0 (San Diego, California, USA). Statistical analyses were conducted with InfoStat software, version 2020 (UNC, Córdoba - Argentina).
3 Results
3.1 Impact of shading on microclimatic conditions inside experimental chambers
Incident radiation inside the chambers was reduced by an average of 80% ± 4.7 compared to measurements taken outside. The cumulative radiation, both inside and outside the chambers, increased steadily until the end of December, reaching 67.48 mol PAR m−2 d−1 outside and 13.49 mol PAR m−2 d−1 inside, corresponding to the 30 DAFB treatment. After this peak, radiation levels declined under both conditions, falling to 46.29 mol PAR m−2 d−1 outside and 9.26 mol PAR m−2 d−1 inside by March, which corresponds to the 120 DAFB treatment.
The HOBO sensor calibration against the weather station data produced the equation y = 1.0773x−0.7165, with a strong correlation (R2 = 0.94). Temperature measurements inside and outside the chambers were then compared across the three seasons, revealing a consistent pattern: maximum temperatures inside the chambers were higher than those outside, while minimum temperatures inside were lower than outside (data not shown). The average difference between mean temperatures inside and outside the chambers was 0.89 ± 0.16 °C, 0.87 ± 0.16 °C, and 1.00 ± 0.09 °C for the 2017–2018, 2018–2019, and 2019–2020 seasons, respectively.
Stem water potential, stomatal conductance, and leaf temperature were measured both outside (blue dots) and inside (pink dots) the shading chambers (Fig. 4). Results in Figure 4A show that stomatal conductance was generally higher outside the chambers compared to inside. In both conditions, conductance followed an increasing trend, peaking around 100 days after full bloom (DAFB) before declining. The differences between inside and outside chambers were statistically significant on six of the thirteen measurement dates (11, 30, 74, 92, 109, and 119 DAFB). Leaf temperature of shaded plants did not differ significantly from that of control plants, as shown in Figure 4B. Finally, Figure 4C illustrates that, although some significant differences were observed under certain conditions, the mean stem water potential remained above –16 bars both inside and outside the chambers, indicating no water stress across all treatments.
 |
Fig. 4 (A) Stomatal conductance, (B) leaf temperature, and (C) stem water potential measured during the 2019–2020 season in olive trees exposed to natural solar radiation (outside, blue symbols) and those covered with intensive shading mesh (inside, pink symbols). Asterisks denote statistically significant differences between treatments on the same date according to Fisher’s LSD test (p < 0.05). |
3.2 Free acidity, peroxide index, and extinction coefficients of extra virgin olive oil
The values for free acidity, peroxide index, and extinction coefficients (K232 and K270) are presented in Supplementary Table 1. No significant differences were found between shaded and control treatments for free acidity (p = 0.3393) or peroxide index (p = 0.0674). Free acidity ranged from 0.17% to 0.21%, while peroxide index values varied between 3.67 and 3.71 meq O2/kg, with all measurements remaining within the International Olive Council (IOC) limits for extra virgin olive oil quality standards.
Significant differences were observed for the extinction coefficients K232 and K270 between shaded treatments and the control (p < 0.0001). The control samples exhibited the lowest values for both coefficients (K232 = 1.12 ± 0.52 and K270 = 0.15 ± 0.12), whereas all shaded treatments showed higher values without significant differences among them (Supplementary Table 1). While K232 values in shaded treatments remained within the IOC acceptable limits for extra virgin olive oil, K270 values exceeded the 0.22 threshold in all shaded groups.
3.3 Total phenol and flavonoid contents of extra virgin olive oil
Phenolic and flavonoid contents extracted from olive oil are presented in Figure 5 and Supplementary Table 2. Total phenolic content ranged from 73 to 151 mg/kg, while flavonoid content ranged from 26 to 49 mg/kg. Both total phenols and flavonoids were significantly reduced in the FB and 30 DAFB treatments compared to the control, with decreases of 48% and 58% for phenols, and 65% and 53% for flavonoids, respectively. In contrast, total phenolic and flavonoid contents in the shaded treatments applied from 60 DAFB to 120 DAFB did not differ significantly from those of the control.
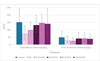 |
Fig. 5 Total phenolic and flavonoid content in extra virgin olive oil (EVOO) from cv. Arbequina trees. Bars represent the means ± standard deviation of three growing seasons (2017–2018, 2018–2019, and 2019–2020). Different letters above bars indicate significant difference among treatments according to the DGC-test (p ≤ 0.05). |
3.4 Phenolic profile of extra virgin olive oil
The phenolic profile of EVOO was characterized using high-performance liquid chromatography (HPLC). Since peak areas cannot be directly compared across different phenolic compounds, the effects of shading on the EVOO phenolic profile are presented relative to the control and expressed as dimensionless values (Supplementary Table 3). Statistically significant differences among treatments were observed only for oleacein (HT-EDA) and oleocanthal, while no significant differences were detected for the other analysed compounds.
For oleacein (HT-EDA), treatments from full bloom (FB) to 90 days after full bloom (90 DAFB) exhibited significantly reduced peak areas compared to the control, with reductions ranging from 49% to 72%. The 120 DAFB treatment did not differ significantly from the control. A similar pattern was observed for oleocanthal. Treatments from FB to 30 DAFB, as well as the 120 DAFB treatment, displayed significantly lower peak areas relative to the control, with reductions ranging from 48% to 75%, whereas the 60 DAFB and 90 DAFB treatments showed no significant differences.
3.5 Fatty acid profile of extra virgin olive oil
The fatty acid composition of EVOO from each treatment is presented in Figure 6 and Supplementary Table 4. On average, cis-oleic, linoleic, and palmitic acids comprised 91.3% of total fatty acid. The concentrations of palmitic, palmitoleic, margaric, margaroleic, stearic, cis-oleic, linoleic, arachidonic, eicosanoic, and lignoceric acids in both control and experimental samples complied with International Olive Council (IOC) standards for EVOO classification. However, trans-oleic and behenic acids exceeded IOC limits across all treatments. Additionally, linolenic acid levels in the 90 DAFB and 120 DAFB treatments were also found to be outside the IOC limits.
All analyzed fatty acids differed significantly among treatments. Palmitic acid content decreased significantly from FB to 90 DAFB compared to the control, with the most pronounced reduction observed between 30 DAFB and 60 DAFB, followed by a significant increase at 120 DAFB. Palmitoleic acid significantly increased in the FB and 120 DAFB treatments, whereas significant decreases were observed at 30 DAFB and 60 DAFB. A similar pattern was observed for margaric acid, which increased at 30 DAFB and 120 DAFB, but decreased at FB relative to the control. For margaroleic acid, the 120 DAFB treatment exhibited a significant increase, while a significant decrease was recorded at 60 DAFB.
Stearic acid and behenic acid followed a similar pattern: both showed significantly higher levels than the control at 30 DAFB and 60 DAFB and significantly lower levels at FB. Cis-oleic acid content significantly increased at 30 DAFB and 60 DAFB, followed by a significant reduction at 120 DAFB. For trans-oleic acid, all treatments except 90 DAFB showed significant differences from the control; the FB and 120 DAFB treatments displayed elevated levels, peaking at FB, while 30 DAFB and 60 DAFB treatments had significantly lower levels.
Linoleic acid content significantly decreased only in the 30 DAFB and 60 DAFB treatments. In contrast, linolenic acid content significantly decreased at FB and 30 DAFB and increased at 90 DAFB and 120 DAFB, while no significant differences were observed at 60 DAFB. Arachidonic acid levels increased significantly only at 120 DAFB. Eicosanoic acid content was affected across all treatments: FB showed a significant decrease, followed by significant increases from 30 DAFB to 120 DAFB. Finally, lignoceric acid exhibited a significant increase starting at 90 DAFB and continuing through 120 DAFB.
The total content of saturated fatty acids (SFA) and unsaturated fatty acids (UFA) are presented in Figure 7 and Supplementary Table 5. In addition, monounsaturated fatty acids (MUFA), and polyunsaturated fatty acids (PUFA), along with relevant ratios, are also presented in Supplementary Table 5. Total SFA content showed a significant increase at 120 DAFB, whereas the other treatments exhibited significant decreases, particularly at 30 DAFB and 60 DAFB. Conversely, total UFA content followed the opposite trend, with a significant decrease at 120 DAFB and significant increases in the remaining treatments, especially at 30 DAFB and 60 DAFB. MUFA and PUFA levels also displayed inverse patterns. MUFA content was significantly higher in all shaded treatments except 120 DAFB, with marked increases at 30 DAFB and 60 DAFB. In contrast, PUFA content significantly decreased in all shaded treatments except 120 DAFB, with pronounced reductions again observed at 30 DAFB and 60 DAFB.
The ratio of UFA/SFA was affected in all treatments. The 120 DAFB treatment exhibited a significant reduction relative to the control, whereas treatments from FB to 90 DAFB showed significant increases, with pronounced rises at 30 DAFB and 60 DAFB. The MUFA/PUFA ratio followed a similar pattern: all treatments except 120 DAFB exhibited significant increases compared to the control, again with marked increases at 30 DAFB and 60 DAFB. Finally, the oleic/linoleic acid ratio significantly increased at 30 DAFB and 60 DAFB relative to the control.
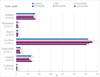 |
Fig. 6 Fatty acid profile in EVOO from cv. Arbequina trees. Bars represent means ± standard deviation across three growing seasons (2017–2018, 2018–2019, and 2019–2020). Different letters forward bars indicate significant difference among treatments according to the DGC-test (p ≤ 0.05) |
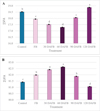 |
Fig. 7 Sum of (A) saturated fatty acids (∑SFA) and (B) unsaturated fatty acids (∑UFA) in EVOO obtained from cv. Arbequina. Bars represent means values ± standard deviation calculated over three growing seasons (2017–2018, 2018–2019, and 2019–2020). Different letters above bars indicate significant differences among treatments according to the DGC test (p ≤ 0.05). |
3.6 Multivariate analysis
To complement the univariate analysis, a Principal Component Analysis (PCA) was performed including environmental, physiological, fatty acid, phenolic, and oil quality variables. The first two principal components explained 68.2% of the total variance, with PC1 accounting for 39.7% and PC2 for 28.5% of the variance (Fig. 8).
The PCA score plot showed a clear distribution of samples according to the timing of the shading treatment. Early stress treatments (Full Bloom, FB, and 30 DAFB) clustered together on the negative side of PC1. The control treatment was positioned on the positive side of PC1. Intermediate shading treatments (60 and 90 DAFB) were located close to the control samples, mainly around the origin of PC2. In contrast, the late stress treatment (120 DAFB) was clearly separated from all other treatments, occupying a distinct quadrant of the biplot.
PC1 represented the main axis of variation among samples. Along this axis, early shading treatments (FB and 30 DAFB) showed negative scores, whereas the control, 60 DAFB, and 90 DAFB treatments showed positive scores. The 120 DAFB treatment was located at the opposite extreme relative to early stress treatments. Vectors corresponding to cumulated radiation, stomatal conductance, total phenols, total flavonoids, and oleocanthal were oriented toward the positive side of PC1, close to the control and intermediate (60 and 90 DAFB) treatments.
PC2 accounted for the second most important source of variation and further differentiated samples according to secondary compositional features. The 120 DAFB treatment showed a marked displacement along PC2, whereas the control, 60 DAFB, and 90 DAFB treatments were positioned near the origin of this axis, indicating similar scores along PC2. Early stress treatments (FB and 30 DAFB) were displaced toward negative PC2 values.
Regarding fatty acid composition, cis-oleic acid was oriented toward the lower-left quadrant of the biplot, close to the FB and 30 DAFB treatments. In contrast, palmitic acid, linoleic acid, and linolenic acid were oriented toward the upper-left quadrant, in the direction of the 120 DAFB treatment. This spatial configuration indicates an inverse relationship between oleic acid and palmitic acid within the PCA space.
Oxidation indices (K232 and K270) were oriented toward the lower-right quadrant of the biplot, away from the control and intermediate treatments and closer to shaded treatments, particularly FB, 30 DAFB, and 90 DAFB. Their vectors showed an opposite orientation to those of cumulated radiation and stomatal conductance.
Several variables, including free acidity, peroxide value, hydroxytyrosol, coumaric acid, and luteolin, were represented by short vectors near the origin of the biplot, indicating a limited contribution to the discrimination among treatments
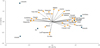 |
Fig. 8 PCA biplot of EVOO parameters of cv. Arbequina measured over three growing seasons (2017–2018, 2018–2019 and 2019–2020), from full bloom (FB) to 120 days after full bloom (DAFB). Treatments are represented by blue symbols, and variables by yellow symbols |
4 Discussion
The findings of this study offer valuable insights into the effects of abiotic stress on olive trees, specifically the Arbequina cultivar, highlighting the associated physiological and biochemical responses during fruit development. Using chambers, we altered the plants’ surrounding environment primarily by reducing the amount of radiation received, which in turn affected photosynthetic activity and the synthesis of key developmental compounds. To prevent overheating and ensure adequate ventilation, the mesh was elevated 50 cm above the ground. Consequently, the temperature difference between the inside and outside of the chambers never exceeded 2 °C, a variation previously reported in the literature as having no significant effect on olive cultivation (Trentacoste et al., 2012).
Previous studies have demonstrated that artificial shading and canopy position influence olive oil fatty acid composition (Cherbiy-Hoffmann et al., 2013; 2015; Rousseaux et al., 2020). However, those studies primarily evaluated radiation gradients or shading intensity effects. In contrast, the present study applied whole-tree shading during sequential, discrete developmental windows. This approach enabled the identification of stage-specific sensitivity of oil quality traits to light reduction, rather than assessing dose–response relationships. Thus, our results provide new insight into the temporal vulnerability of fatty acid composition during fruit development.
Concerning their physiological status, shaded plants exhibited reduced stomatal aperture compared to those outside the chamber, likely limiting gas exchange (CO2 and H2O) and consequently reducing photosynthetic activity (Bongi and Loreto, 1989). Conversely, plants outside the chamber exhibited greater stomatal opening without significant differences in leaf temperature. The significant reduction in stomatal conductance observed in shaded trees is a well-established indicator of reduced CO2 diffusion and limited net assimilation under low irradiance conditions in olive trees. This suggests increased transpiration driven by higher solar radiation. Regarding plant water status, all treatments, including shaded and control plants, were subjected to the same irrigation regime. Although minor differences among treatments were observed, they did not significantly affect water availability, as water potential measurements consistently remained above −1.6 MPa. According to Moriana et al. (2002), this threshold indicates the absence of water stress in olive trees, supporting the interpretation that the observed responses were not driven by hydric limitations. Taken together, these observations suggest that the metabolic responses observed are more likely associated with reduced photosynthetic carbon availability than with water stress.
Therefore, the experimental design allowed precise control over the timing and intensity of radiation stress, ensuring that observed changes in olive fruit composition were specifically attributable to radiation effects. Previous studies on olives have shown that abiotic stresses such as water deficit (Perez-Martin et al., 2014), elevated temperatures (Haworth et al., 2018) and excess chloride ions (Bongi and Loreto, 1989; El Yamani and Cordovilla, 2024) induce stomatal closure and activate tolerance mechanisms, consistent with our finding.
Abiotic stress applied during specific fruit development stages in cv. Arbequina influenced several physicochemical and biochemical parameters of EVOO. Free acidity and peroxide index remained low and stable across all treatments, consistent with Lémole et al., (2018) and Busso (2025), indicating that none of the stress conditions triggered lipid peroxidation or compromised oil classification. However, extinction coefficients K232 and K270, which indicate the presence of conjugated dienes and trienes respectively, showed significantly increases under shading, at every developmental window applied, revealing an accelerated formation of both primary and secondary oxidation compounds. Notably, K270 values exceeded the IOC threshold for extra virgin olive oil classification in all treatments, suggesting that the abiotic stress accelerates oxidative processes and may affect oil shelf life.
Phenolic and flavonoid contents, which contribute to antioxidant potential (Salta et al., 2007), nutraceutical properties and sensory attributes of EVOO (Khalatbary, 2013; Ceci et al., 2017; Ly et al., 2021), were most sensitive during the first 60 days after full bloom. Stress during this early phase may be impairing their biosynthesis, likely due to the vulnerability of metabolic pathways at that stage. This aligns with previous finding that ‘Arbequina’, a cultivar with inherently low phenolic content (Montedoro et al., 1992), exhibits limited capacity to recover phenolic levels once disrupted (Alagna et al., 2012; Lémole et al., 2018). This underscores the critical role of early fruit development in determining the nutraceutical properties and antioxidant potential of EVOO.
Among individual compounds, oleacein and oleocanthal, secoiridoid derivatives synthesized via the mevalonic acid pathway (Paul et al., 2023), showed distinct stage-dependent behavior under stress: oleacein levels were significantly decreased from FB to 90 DAFB, whereas oleocanthal was notably decreased during FB to 30 DAFB and again at 120 DAFB. On the other hand, hydroxytyrosol, coumaric acid, and luteolin remained stable, suggesting that the shikimic acid pathway is less affected by light reduction. These results highlight the selective sensitivity of phenolic biosynthesis routes to environmental stress (Alagna et al., 2012). The stability of hydroxytyrosol and luteolin, in contrast to the declination observed in oleuropein derivatives (oleacein and oleocanthal), suggests that the shikimic acid pathway, responsible for the synthesis of simple phenolic compounds, may be more resilient to light stress than the mevalonic acid-dependent pathway involved in secoiridoid biosynthesis. This differential response could be related to the higher metabolic cost associated with the synthesis of complex secoiridoids under carbon-limited conditions induced by shading. These observations may indicate a preferential allocation of carbon toward simpler phenolic compounds under reduced light availability, although further metabolic studies would be required to confirm this hypothesis. Thus, the stress experienced during fruit development may not impair enzymatic activity during EVOO extraction, leaving hydroxytyrosol, coumaric acid, and luteolin concentrations unchanged, consistent with Tovar et al. (2001), or alternatively, plants may have the capacity to recover from applied stress.
Fatty acid composition was also strongly influenced by stress timing. Cis-oleic acid, the most desirable monounsaturated fatty acid due to its well-established nutraceutical and antioxidant properties (Menendez, 2005; Ceci and Carelli, 2010; Santa-María et al., 2023), peaked between 30–60 DAFB and declined significantly at 120 DAFB, inversely correlating with palmitic acid levels. These results are consistent with the thermal and light accumulation models developed for non-Mediterranean regions by Rondanini et al. (2014). The Arbequina cultivar is particularly sensitive to environmental conditions, and previous research has shown that in warm climates, ‘Arbequina’ olives produce EVOO with oleic acid levels below 55% (Rondanini et al., 2011). In this study, cis-oleic acid was the predominant fatty acid in all EVOO samples, ranging from 60.64% to 65.74%.
Elevated stearic acid and reduced palmitic acid during early development suggest enhanced KAS II activity under stress, while late-stage stress may suppress this enzyme's function. Conversely, severe stress toward the end of fruit development appears to suppress KAS II function, consistent with observations from palm cultivation studies (Sánchez and Salas, 2000). KAS II specifically catalyzes the production of stearate, the direct precursor of oleic acid (Jones et al., 2000). These alterations highlight the complex interplay between environmental stressors and enzymatic regulation, which affects oil composition and quality.
Desaturation dynamics involves two key enzymes: oleate Δ12-desaturase (FAD2), which converts oleic acid to linoleic acid (C18:2), and linoleate Δ15-desaturase (FAD3), which converts linoleic acid to linolenic acid (C18:3) (Hernández et al., 2009; Soltani Gishini et al., 2025). Regarding linolenic acid, the most sensitive period appears to be in full bloom (FB), implying that stress may suppress FAD3 activity. The low linolenic acid concentrations observed at 30 DAFB may reflect limited precursor availability, while its late stage increase exceeded IOC limits in some samples. At the final stage analyzed (from 120 DAFB onward), some minor fatty acids, such as linolenic acid, increased to levels exceeding the limits established by the IOC.
Despite these shifts, ∑MUFA levels remained stable or increased under stress, while ∑PUFA declined, favoring oil stability and nutritional value.
Overall, the timing of abiotic stress plays a decisive role in shaping the physicochemical and nutraceutical profile of ‘Arbequina’ EVOO. Early developmental stages are particularly critical for phenolic biosynthesis and oleic acid accumulation, while late-stage stress may compromise oxidative stability and fatty acid balance. These findings underscore the importance of precise canopy and harvest management strategies to mitigate climate-induced quality losses in high-density olive production systems.
The use of Principal Component Analysis (PCA) was essential to integrate environmental, physiological, and chemical variables into a single analytical framework. This multivariate approach allows the identification of coordinated response patterns that cannot be fully resolved through univariate analyses. The first two components explained 68.4% of the total variance, which is considered robust for field-based agronomic studies characterized by high biological variability.
PC1 can be interpreted as a gradient associated with solar radiation availability and oil quality. Variables related to incident radiation, stomatal conductance, total phenols, total flavonoids, and oleocanthal were positively aligned along this axis. The control treatment, together with the intermediate shading treatments (60 and 90 DAFB), clustered near these vectors, indicating similar multivariate profiles.
In contrast, early shading treatments (FB and 30 DAFB) were positioned on the opposite side of PC1, reflecting a coordinated reduction in radiation exposure, physiological performance, and phenolic accumulation. This pattern suggests that the reduction in oil quality observed under early shading is not driven by isolated variables, but rather by a concerted response involving multiple physiological and biochemical traits.
An important outcome of the PCA is the proximity of the 60 and 90 DAFB treatments to the control samples, particularly around the origin of PC2. This indicates that shading imposed during mid-fruit development induced only moderate changes in the overall multivariate profile, resulting in oil compositions more similar to the control than to early or late stress treatments. This intermediate positioning (60–90 DAFB) suggests a degree of resilience or compensatory capacity during this developmental window, where physiological and metabolic processes may partially buffer the effects of reduced solar radiation availability. As a result, mid-season shading appears to have a limited impact on both phenolic composition and fatty acid balance compared with shading applied at earlier or later stages.
PC2 captured secondary sources of variation primarily associated with fatty acid composition and leaf temperature. Along this axis, the 120 DAFB treatment was clearly separated from all other treatments, indicating a distinct lipid profile under late shading conditions.
The association of 120 DAFB with palmitic, linoleic, and linolenic acids suggests that shading during late fruit development promotes a shift toward higher proportions of saturated and polyunsaturated fatty acids. In contrast, cis-oleic acid was more closely associated with early developmental stages, particularly FB and 30 DAFB. These results indicate that lipid metabolism remains highly sensitive to environmental conditions during the late stages of fruit development (Lémole et al., 2018).
The PCA also revealed a strong inverse relationship between phenolic compounds and oxidation indices. Extinction coefficients K232 and K270 were oriented opposite to phenolic variables and to radiation and stomatal conductance, indicating that oils with lower phenolic content tend to exhibit higher levels of oxidation products. This relationship was particularly evident for early shading treatments and for late stress treatment (120 DAFB), whereas control, 60 DAFB, and 90 DAFB samples clustered away from oxidation vectors. This pattern highlights the close linkage between physiological stress, antioxidant depletion, and oxidative stability of the oil.
Finally, the PCA allowed identification of variables with limited responsiveness to shading stress. Hydroxytyrosol, luteolin, coumaric acid, free acidity, and peroxide value were represented by short vectors near the origin, indicating stability across treatments. This contrasts with the pronounced variability observed for secoiridoids such as oleocanthal. These findings suggest a selective metabolic sensitivity to shading, whereby certain biosynthetic pathways remain relatively stable, while others respond strongly to changes in light availability. This selective response contributes to the observed differences in oil quality among treatments.
Interestingly, preliminary results suggest that abiotic stress applied during specific fruit development stages in cv. Arbequina did not appear to affect yield components.
From a crop management perspective, our results support the adoption of moderate pruning practices aimed at preserving optimal canopy architecture and light interception while avoiding excessive and unproductive vegetative growth, which may exacerbate stress sensitivity during critical fruit developmental stages. In semi-arid regions, this approach can improve the balance between source and sink activity and reduce intra-canopy shading during stress-prone periods.
In addition, the identification of stress-sensitive phenological stages provides a framework for fine-tuning irrigation management. Where supplemental irrigation is available, priority should be given to maintaining adequate plant water status during these critical windows rather than applying uniform irrigation throughout the season, thereby improving water-use efficiency without compromising yield.
Early harvesting also emerges as a complementary strategy, particularly in high-density orchards, as it may help mitigate alternate bearing, limit prolonged exposure of fruits to late-season abiotic stress and promote a more favourable nutritional balance. This, in turn, contributes to greater yield stability and improved olive oil physicochemical and biochemical quality.
The results obtained for ‘Arbequina’ provide the basis for future comparative studies with high-phenolic varieties such as Picual or Coratina, which would allow a broader interpretation of varietal responses
5 Conclusions
The results of this study demonstrate that the timing of abiotic stress during olive fruit development significantly influences the chemical composition and quality parameters of EVOO. Each developmental phase plays a distinct role in shaping oil stability and sensory attributes. Early developmental stages are particularly sensitive: stress applied during this period adversely affects phenolic biosynthesis while enhancing fatty acid profiles, notably increasing oleic acid levels and reducing linoleic and linolenic acids. Although conducted under specific semi-arid conditions, this study identifies stress-sensitive developmental stages that are broadly applicable to olive production worldwide.
Identifying the specific developmental windows most vulnerable to stress-induced metabolic shifts is crucial for designing adaptive cultivation strategies that preserve the desirable characteristics and long-term stability of EVOO, as increasing environmental variability under climate change is likely to intensify stress and compromise oil quality.
Overall, the multivariate analysis confirms that the impact of shading on olive oil quality is strongly dependent on the timing of stress application. Early and late shading generate distinct chemical signatures, whereas mid-season shading (60 and 90 DAFB) results in oil compositions closer to those of the control. By integrating physiological, biochemical, and quality-related variables, the PCA provides a coherent framework linking light availability, plant function, and olive oil composition.
Future research should extend this approach to other types of abiotic stress in order to identify critical periods that are shared with, or distinct from, those identified in the present study, as well as to additional cultivars and species. Nevertheless, by linking fruit development stages with oil composition changes under stress, this research provides a basis for improving climate adaptation strategies in perennial crops beyond olive.
Acknowledgments
This publication forms part of the author's PhD thesis to be defended in the Doctoral Program in Agronomy at the Faculty of Agricultural Sciences, Universidad Nacional de Cuyo (Argentina).
Supplementary Material
Supplementary Table 1. Free acidity, peroxide index, and extinction coefficients (K232 and K270) of extra virgin olive oil (EVOO) from Olea europaea L cv. Arbequina trees. Data represent means ± standard deviation from three growing seasons (2017-2018, 2018-2019, and 2019-2020).
Supplementary Table 2. Total phenolic and flavonoid content in extra virgin olive oil (EVOO) from cv. Arbequina trees. Data represent the means ± standard deviation of three growing seasons (2017-2018, 2018-2019, and 2019-2020).
Supplementary Table 3.. Phenolic profiles relative to the control in extra virgin olive oil (EVOO) from cv. Arbequina trees. Data represent the means ± standard deviation from the 2019–2020 growing season.
Supplementary Table 4. Fatty acid profile from EVOO from cv. Arbequina trees. Data are expressed as means ± standard deviation from three growing seasons (2017-2018, 2018-2019, and 2019-2020).
Supplementary Table 5. Fatty acid ratios of EVOO from cv. Arbequina trees. Data are expressed as means ± standard deviation from three growing seasons (2017-2018, 2018-2019, and 2019-2020).
Access Supplementary MaterialReferences
- Aguilera CM, Mesa MD, Ramirez-Tortosa MC, Nestares MT, Ros E, Gil A. 2004. Sunflower oil does not protect against LDL oxidation as virgin olive oil does in patients with peripheral vascular disease. Clin Nutr 23: 673–681. https://doi.org/10.1016/j.clnu.2003.11.005. [Google Scholar]
- Aguilera MP, Beltrán G, Ortega D, Fernández A, Jiménez A, Uceda M. 2005. Characterization of virgin olive oil of Italian olive cultivars: “Frantoio” and “Leccino”, grown in Andalusia. Food Chem 89: 387–391. https://doi.org/10.1016/j.foodchem.2004.02.046. [Google Scholar]
- Alagna F, Mariotti R, Panara F, et al. 2012. Olive phenolic compounds: metabolic and transcriptional profiling during fruit development. BMC Plant Biol 12: 162. https://doi.org/10.1186/1471-2229-12-162. [Google Scholar]
- Araújo M, Prada J, Mariz-Ponte N, et al. 2021. Antioxidant adjustments of olive trees (Olea europaea) under field stress conditions. Plants 10: 684. https://doi.org/10.3390/plants10040684. [Google Scholar]
- Banco AP, Puertas CM, Trentacoste ER, Gariglio NF, Jofré VP. 2022. Promising olive varieties for extra virgin oil production in Mendoza, Argentina. 62–70. https://doi.org/10.1016/j.jssas.2022.06.003. [Google Scholar]
- Bianchetti R, Ali A, Gururani M. 2024. Abscisic acid and ethylene coordinating fruit ripening under abiotic stress. Plant Sci 349. https://doi.org/10.1016/j.plantsci.2024.112243. [Google Scholar]
- Bongi G, Loreto F. 1989. Gas-exchange properties of salt-stressed olive (Olea europaea L.) leaves. Plant Physiol 90: 1408–1416. https://doi.org/10.1104/pp.90.4.1408. [Google Scholar]
- Brito C, Dinis LT, Moutinho-Pereira J, Correia CM. 2019. Drought stress effects and olive tree acclimation under a changing climate. Plants 8: 232. https://doi.org/10.3390/plants8070232. [Google Scholar]
- Busso M. 2025. Effect of various water levels on yield, quality, and fatty acid concentration of olive oil. Horticultura Argentina 44(113): 79–101. https://id.caicyt.gov.ar/ark:/s18519342/ln62yi42p. [Google Scholar]
- Castillo FM, Vásquez SC, Calderini DF. 2017. Does the pre-flowering period determine the potential grain weight of sunflower? Field Crops Res 212: 23–33. https://doi.org/10.1016/j.fcr.2017.06.029. [Google Scholar]
- Ceci LN, Carelli AA. 2010. Relation between oxidative stability and composition in Argentinian olive oils. J Am Oil Chem Soc 87: 1189–1197. https://doi.org/10.1007/s11746-010-1598-6. [Google Scholar]
- Ceci LN, Ramírez D, Mussio DF, Mattar SB, Carelli AA. 2017. Biophenols and flavor in extra virgin olive oils from San Juan Province (Argentina). J Am Oil Chem Soc 94: 643–654. https://doi.org/10.1007/s11746-017-2985-z. [Google Scholar]
- Cerrudo A, Di Matteo J, Fernandez E, Robles M, Pico LO, Andrade FH. 2013. Yield components of maize as affected by short shading periods and thinning. Crop Pasture Sci 64: 580. https://doi.org/10.1071/CP13201. [Google Scholar]
- Cherbiy-Hoffmann SU, Hall AJ, Rousseaux MC. 2013. Fruit, yield, and vegetative growth responses to photosynthetically active radiation during oil synthesis in olive trees. Sci Hortic 150: 110–116. https://doi.org/10.1016/j.scienta.2012.10.027. [Google Scholar]
- Cherbiy-Hoffmann SU, Searles PS, Hall AJ, Rousseaux MC. 2015. Responses of olive tree yield determinants and components to shading during potentially critical phenological phases. Scientia Horticulturae 184, 70–77. https://doi.org/10.1016/j.scienta.2014.12.011 [Google Scholar]
- Connor DJ, Gómez del Campo M, Trentacoste ER. 2016. Relationships between olive yield components and simulated irradiance within hedgerows of various row orientations and spacings. Sci Hortic 198: 12–20. https://doi.org/10.1016/j.scienta.2015.11.009. [Google Scholar]
- Dag A, Ben-Gal A, Yermiyahu U, Basheer L, Nir Y, Kerem Z. 2008. The effect of irrigation level and harvest mechanization on virgin olive oil quality in a traditional rain-fed ‘Souri’ olive orchard converted to irrigation. J Sci Food Agric 88: 1524–1528. http://doi.wiley.com/10.1002/jsfa.3243. [Google Scholar]
- Diez J, Tiranti JA, Sadras VO, Acreche MM. 2021. The critical period for grain yield in chia. Crop Pasture Sci 72: 213–222. https://doi.org/10.1071/CP20432. [Google Scholar]
- El Yamani M, Cordovilla MDP. 2024. Tolerance mechanisms of olive tree (Olea europaea) under saline conditions. Plants 13: 2094. https://doi.org/10.3390/plants13152094. [Google Scholar]
- Fraga H, Moriondo M, Leolini L, Santos JA. 2020. Mediterranean olive orchards under climate change: a review of future impacts and adaptation strategies. Agronomy 11: 56. https://doi.org/10.3390/agronomy11010056. [CrossRef] [Google Scholar]
- García-Inza GP, Castro DN, Hall AJ, Rousseaux MC. 2014. Responses to temperature of fruit dry weight, oil concentration, and oil fatty acid composition in olive (Olea europaea L. var. ‘Arauco’). Eur J Agron 54: 107–115. https://doi.org/10.1016/j.eja.2013.12.005. [Google Scholar]
- Gómez-del-Campo M, García JM. 2012. Canopy fruit location can affect olive oil quality in ‘Arbequina’ hedgerow orchards. J Am Oil Chem Soc 89: 123–133. https://doi.org/10.1007/s11746-011-1900-2. [Google Scholar]
- Greven M, Neal S, Green S, Dichio B, Clothier B. 2009. The effects of drought on the water use, fruit development and oil yield from young olive trees. Agric Water Manag 96: 1525–1531. https://doi.org/10.1016/j.agwat.2009.06.002. [Google Scholar]
- Hamze L, Miserere A, Molina MS, Maestri D, Searles PS, Rousseaux MC. 2022. Influence of environmental growth temperature on tocopherol and sterol oil concentrations in olive fruit. J Sci Food Agric 102: 2741–2749. https://doi.org/10.1002/jsfa.11615. [Google Scholar]
- Haworth M, Marino G, Brunetti C, Killi D, De Carlo A, Centritto M. 2018. The impact of heat stress and water deficit on the photosynthetic and stomatal physiology of olive (Olea europaea L.)—a case study of the 2017 heat wave. Plants 7: 76. https://doi.org/10.3390/plants7040076. [Google Scholar]
- Hernández ML, Padilla MN, Martínez-Rivas JM. 2009. Expression analysis identifies FAD2-2 as the olive oleate desaturase gene mainly responsible for the linoleic acid content in virgin olive oil. J Agric Food Chem 57: 6199–6206. https://doi.org/10.1021/jf900678z. [Google Scholar]
- Hernández ML, Padilla MN, Sicardo MD, Mancha M, Martínez-Rivas JM. 2011. Effect of different environmental stresses on the expression of oleate desaturase genes and fatty acid composition in olive fruit. Phytochemistry 72: 178–187. https://doi.org/10.1016/j.phytochem.2010.11.026. [Google Scholar]
- International Olive Council. 2023. World olive oil. https://www.internationaloliveoil.org/what-we-do/statistics/#figures (accessed 10 March 25). [Google Scholar]
- International Olive Council. 2022. Trade standard applying to olive oils and olive pomace oils. https://www.internationaloliveoil.org/wp-content/uploads/2022/12/Norme-comerciale-REV-19_ENK.pdf (accessed 18 October 24). [Google Scholar]
- Jemai H, Bouaziz M, Sayadi S. 2009. Phenolic composition, sugar contents and antioxidant activity of tunisian sweet olive cultivar with regard to fruit ripening. J Agric Food Chem 57: 2961–2968. https://doi.org/10.1021/jf8034176. [Google Scholar]
- Jones AL, Herbert D, Rutter AJ, Dancer JE, Harwood JL. 2000. Novel inhibitors of the condensing enzymes of the Type II fatty acid synthase of pea (Pisum sativum). Biochem J 1: 205–209. https://doi.org/10.1042/bj3470205. [Google Scholar]
- Khalatbary AR. 2013. Olive oil phenols and neuroprotection. Nutr Neurosci 16: 243–249. https://doi.org/10.1179/1476830513Y.0000000052. [Google Scholar]
- Lake L, Godoy-Kutchartt DE, Calderini DF, Verrell A, Sadras VO. 2019. Yield determination and the critical period of faba bean (Vicia faba L.). Field Crops Res 241: 107575. https://doi.org/10.1016/j.fcr.2019.107575. [Google Scholar]
- Lake L, Sadras VO. 2014. The critical period for yield determination in chickpea (Cicer arietinum L.). Field Crops Res 168: 1–7. https://doi.org/10.1016/j.fcr.2014.08.003. [Google Scholar]
- Lémole G, Weibel AM, Trentacoste ER. 2018. Effect of shading in different periods from flowering to maturity on the fatty acid and phenolic composition of olive oil (cv. Arbequina). Sci Hortic 240: 162–169. https://doi.org/10.1016/j.scienta.2018.06.005. [Google Scholar]
- Leporini M, Loizzo MR, Tenuta MC, et al. 2018. Calabrian extra-virgin olive oil from Frantoio cultivar: chemical composition and health properties. Emir J Food Agric 631. https://doi.org/10.9755/ejfa.2018.v30.i7.1743. [Google Scholar]
- Lozano-Castellón J, López-Yerena A, Rinaldi de Alvarenga JF, et al. 2020. Health-promoting properties of oleocanthal and oleacein: two secoiridoids from extra-virgin olive oil. Crit Rev Food Sci Nutr 19: 1–17. https://doi.org/10.1080/ 10408398.2019.1650715. [Google Scholar]
- Ly TTG, Yun J, Lee DH, Chung JS, Kwon SM. 2021. Protective effects and benefits of olive oil and its extracts on women’s health. Nutrients 13: 4279. https://doi.org/10.3390/nu13124279. [Google Scholar]
- Matsuki M. 1996. Regulation of plant phenolic synthesis: from biochemistry to ecology and evolution. Aust J. Bot 44: 613. https://doi.org/10.1071/BT9960613. [Google Scholar]
- Menendez JA. 2005. Oleic acid, the main monounsaturated fatty acid of olive oil, suppresses Her-2/neu (erbB-2) expression and synergistically enhances the growth inhibitory effects of trastuzumab (HerceptinTM) in breast cancer cells with Her-2/neu oncogene amplification. Ann. Oncol. 16, 359–371. https://doi.org/10.1093/annonc/mdi090. [Google Scholar]
- Miserere A, Rousseaux MC, Ploschuk EL, et al. 2021. Effects of prolonged elevated temperature on leaf gas exchange and other leaf traits in young olive trees. Tree Physiol 41: 254–268. https://doi.org/10.1093/treephys/tpaa118. [Google Scholar]
- Monasterio RP, Banco AP, Calderón FJ, Trentacoste ER. 2021. Effects of pre-harvest deficit irrigation during the oil accumulation period on fruit characteristics, oil yield extraction, and oil quality in olive cv. Genovesa in an arid region of Argentina. Agric Water Manag 252. https://doi.org/10.1016/j.agwat.2021.106901. [Google Scholar]
- Montedoro G, Servili M, Baldioli M, Miniati E. 1992. Simple and hydrolyzable phenolic compounds in virgin olive oil. 1. Their extraction, separation, and quantitative and semiquantitative evaluation by HPLC. J Agric Food Chem 40: 1571–1576. https://doi.org/10.1021/jf00021a019. [Google Scholar]
- Moriana A, Villalobos FJ, Fereres E. 2002. Stomatal and photosynthetic responses of olive (Olea europaea L.) leaves to water deficits. Plant Cell Environ 25: 395–405. https://doi.org/10.1046/j.0016-8025.2001.00822.x. [Google Scholar]
- Mradu G, Saumyakanti S, Sohini M, Arup M. 2012. HPLC profiles of standard phenolic compounds present in medicinal plants. Salicylic Acid 4. [Google Scholar]
- Nissim Y, Shlosberg M, Biton I, et al. 2020. A high temperature environment regulates the olive oil biosynthesis network. Plants 9: 1135. https://doi.org/10.3390/plants9091135. [Google Scholar]
- Patumi M, d’Andria R, Marsilio V, Fontanazza G, Morelli G, Lanza B. 2002. Olive and olive oil quality after intensive monocone olive growing (Olea europaea L., cv. Kalamata) in different irrigation regimes. Food Chem 77: 27–34. https://doi.org/10.1016/S0308-8146(01)00317-X. [Google Scholar]
- Paul A, Acharya K, Chakraborty N. Involvement of phenylpropanoid pathway and shikimic acid pathway in environmental stress response. In: Biology and biotechnology of environmental stress tolerance in plants. Apple Academic Press, 2023, pp. 27–66. [Google Scholar]
- Perez-Martin A, Michelazzo C, Torres-Ruiz JM, et al. 2014. Regulation of photosynthesis and stomatal and mesophyll conductance under water stress and recovery in olive trees: correlation with gene expression of carbonic anhydrase and aquaporins. J Exp Bot 65: 3143–3156. https://doi.org/10.1093/jxb/eru160. [Google Scholar]
- Rondanini DP, Castro DN, Searles PS, Rousseaux MC. 2014. Contrasting patterns of fatty acid composition and oil accumulation during fruit growth in several olive varieties and locations in a non-Mediterranean region. Eur J Agron 52: 237–246. https://doi.org/10.1016/j.eja.2013.09.002. [Google Scholar]
- Rondanini DP, Castro DN, Searles PS, Rousseaux MC. 2011. Fatty acid profiles of varietal virgin olive oils (Olea europaea L.) from mature orchards in warm arid valleys of Northwestern Argentina (La Rioja). Grasas Aceites 62: 399–409. https://doi.org/10.3989/gya.125110. [Google Scholar]
- Rousseaux MC, Cherbiy-Hoffmann SU, Hall AJ, Searles PS. 2020. Fatty acid composition of olive oil in response to fruit canopy position and artificial shading. Scientia Horticulturae 271, 109477. https://doi.org/10.1016/j.scienta.2020.109477 [Google Scholar]
- Salta FN, Mylona A, Chiou A, Boskou G, Andrikopoulos NK. 2007. Oxidative stability of edible vegetable oils enriched in polyphenols with olive leaf extract. Food Sci Technol Int 13: 413–421. https://doi.org/10.1177/1082013208089563. [Google Scholar]
- Sánchez J, Salas JJ. Biogenesis of Olive Oil Aroma. In: Harwood J, Aparicio R, eds. Handbook of Olive Oil. Springer US, Boston, MA, 2000, pp. 79–99. https://doi.org/10.1007/978-1-4757-5371-4_4. [Google Scholar]
- Sánchez LC, Trentacoste ER. Evaluación de la tolerancia a bajas temperaturas del germoplasma de olivo presente en la provincia de Mendoza. In: Colección de Olivos En Mendoza. Investigación y Caracterización de Variedades. Instituto Nacional de Tecnología Agropecuaria. INTA Junín, Mendoza, Argentina, 2020. [Google Scholar]
- Santa-María C, López-Enríquez S, Montserrat-de La Paz S, et al. 2023. Update on anti-inflammatory molecular mechanisms induced by oleic acid. Nutrients 15: 224. https://doi.org/10.3390/nu15010224. [Google Scholar]
- Sanz-Cortes F, Martinez-Calvo J, Badenes ML, et al. 2002. Phenological growth stages of olive trees (Olea europaea). Ann Appl Biol 140: 151–157. https://doi.org/10.1111/j.1744-7348.2002.tb00167.x. [Google Scholar]
- Soltani Gishini MF, Kachroo P, Hildedrand D. 2025. Fatty acid desaturase 3-mediated α-linolenic acid biosynthesis in plants 197, kiaf012. https://doi.org/10.1093/plphys/kiaf012. [Google Scholar]
- Soriguer F, Rojo-Martínez G, Goday A, et al. 2013. Olive oil has a beneficial effect on impaired glucose regulation and other cardiometabolic risk factors. This email address is being protected from spambots. You need JavaScript enabled to view it. study. Eur J Clin Nutr 67: 911–916. https://doi.org/10.1038/ejcn.2013.130. [Google Scholar]
- Tovar M, Romero M, Alegre S, Girona J, Motilva M. 2002. Composition and organoleptic characteristics of oil from Arbequina olive (Olea europaea L) trees under deficit irrigation. J Sci Food Agric 82: 1755–1763. https://doi.org/10.1002/jsfa.1246. [Google Scholar]
- Tovar MJ, Motilva MJ, Romero MP. 2001. Changes in the phenolic composition of virgin olive oil from young trees (Olea europaea L. cv. Arbequina) grown under linear irrigation strategies. J Agric Food Chem 49: 5502–5508. https://doi.org/10.1021/jf0102416. [Google Scholar]
- Trentacoste ER, Calvo FE, Sánchez CL, Calderón FJ, Banco AP, Lémole G. 2022. Response of inflorescence structure and oil yield components to source-sink manipulation by artificial shading in olive. Theor Exp Plant Physiol 34: 171–183. https://doi.org/10.1007/s40626-022-00239-z. [Google Scholar]
- Trentacoste ER, Connor DJ, Gómez-del-Campo M. 2015. Row orientation: Applications to productivity and design of hedgerows in horticultural and olive orchards. Sci Hortic 187: 15–29. https://doi.org/10.1016/j.scienta.2015.02.032. [Google Scholar]
- Trentacoste ER, Puertas CM, Sadras VO. 2012. Modelling the intraspecific variation in the dynamics of fruit growth, oil and water concentration in olive (Olea europaea L.). Eur J Agron 38: 83–93. https://doi.org/10.1016/j.eja.2012.01.001. [Google Scholar]
- Vita Serman F, Orgaz F, Starobinsky G, Capraro F, Fereres E. 2021. Water productivity and net profit of high-density olive orchards in San Juan, Argentina. Agric Water Manag. https://doi.org/10.1016/j.agwat.2021.106878. [Google Scholar]
Cite this article as: Banco A, Trentacoste E, Rodriguez-Marquez M, Garbus I. 2026. Critical Fruit Developmental Periods Influencing Oil Quality in Olive (cv. Arbequina) Under Reduced Solar Radiation. OCL 33: 17. https://doi.org/10.1051/ocl/2026008
All Figures
|
Fig. 1 Photo of one of the chambers used during assay. |
| In the text | |
|
Fig. 2 Photo of an inflorescence in full bloom used as a reference to determine the stage BBCH65. |
| In the text | |
|
Fig. 3 Maximum and minimum temperatures recorded outside the shading chambers during the three seasons (A) 2017–2018 (B) 2018–2019 (C) 2019–2020. Harvest dates for each season are also indicated. |
| In the text | |
|
Fig. 4 (A) Stomatal conductance, (B) leaf temperature, and (C) stem water potential measured during the 2019–2020 season in olive trees exposed to natural solar radiation (outside, blue symbols) and those covered with intensive shading mesh (inside, pink symbols). Asterisks denote statistically significant differences between treatments on the same date according to Fisher’s LSD test (p < 0.05). |
| In the text | |
|
Fig. 5 Total phenolic and flavonoid content in extra virgin olive oil (EVOO) from cv. Arbequina trees. Bars represent the means ± standard deviation of three growing seasons (2017–2018, 2018–2019, and 2019–2020). Different letters above bars indicate significant difference among treatments according to the DGC-test (p ≤ 0.05). |
| In the text | |
|
Fig. 6 Fatty acid profile in EVOO from cv. Arbequina trees. Bars represent means ± standard deviation across three growing seasons (2017–2018, 2018–2019, and 2019–2020). Different letters forward bars indicate significant difference among treatments according to the DGC-test (p ≤ 0.05) |
| In the text | |
|
Fig. 7 Sum of (A) saturated fatty acids (∑SFA) and (B) unsaturated fatty acids (∑UFA) in EVOO obtained from cv. Arbequina. Bars represent means values ± standard deviation calculated over three growing seasons (2017–2018, 2018–2019, and 2019–2020). Different letters above bars indicate significant differences among treatments according to the DGC test (p ≤ 0.05). |
| In the text | |
|
Fig. 8 PCA biplot of EVOO parameters of cv. Arbequina measured over three growing seasons (2017–2018, 2018–2019 and 2019–2020), from full bloom (FB) to 120 days after full bloom (DAFB). Treatments are represented by blue symbols, and variables by yellow symbols |
| In the text | |
Current usage metrics show cumulative count of Article Views (full-text article views including HTML views, PDF and ePub downloads, according to the available data) and Abstracts Views on Vision4Press platform.
Data correspond to usage on the plateform after 2015. The current usage metrics is available 48-96 hours after online publication and is updated daily on week days.
Initial download of the metrics may take a while.