")
")
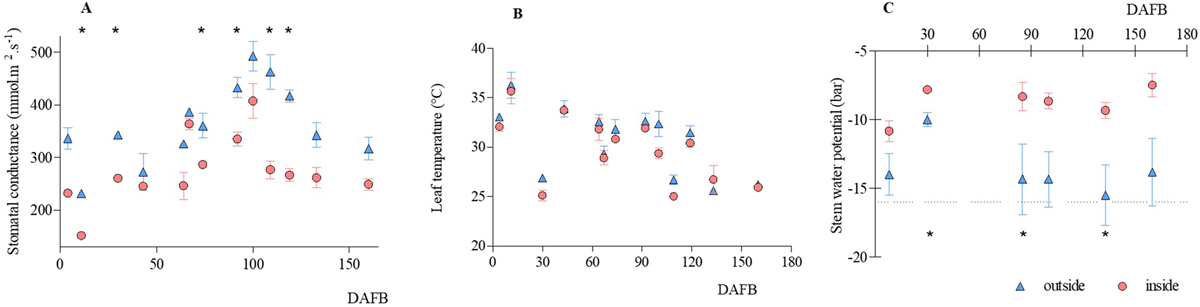
Fig. 4
Download original image
(A) Stomatal conductance, (B) leaf temperature, and (C) stem water potential measured during the 2019–2020 season in olive trees exposed to natural solar radiation (outside, blue symbols) and those covered with intensive shading mesh (inside, pink symbols). Asterisks denote statistically significant differences between treatments on the same date according to Fisher’s LSD test (p < 0.05).
Current usage metrics show cumulative count of Article Views (full-text article views including HTML views, PDF and ePub downloads, according to the available data) and Abstracts Views on Vision4Press platform.
Data correspond to usage on the plateform after 2015. The current usage metrics is available 48-96 hours after online publication and is updated daily on week days.
Initial download of the metrics may take a while.