")
")
| Issue |
OCL
Volume 32, 2025
Diversity of Plant Proteins extracted from Oil & Protein Crop / Diversité des protéines végétales issues des oléoprotéagineux
|
|
|---|---|---|
| Article Number | 16 | |
| Number of page(s) | 13 | |
| DOI | https://doi.org/10.1051/ocl/2025008 | |
| Published online | 04 June 2025 | |
Research Article
Analysis of the factors that influence the quality of rapeseed and sunflower seeds and development of predictive models☆
Analyse des facteurs impactant la qualité des graines du colza et tournesol, et développement de modèles prédictifs
1
Terres Inovia, 78850 Thiverval-Grignon, France
2
Université de Toulouse, INRAE, UMR AGIR, 31326 Castanet-Tolosan, France
* Corresponding author: This email address is being protected from spambots. You need JavaScript enabled to view it.
Received:
22
October
2024
Accepted:
14
March
2025
Abstract
This study examined the factors influencing the quality of rapeseed (Brassica napus L.) and sunflower (Helianthus annuus L.) seeds, to find out the factors having the greatest impact on protein and oil concentration. Historical data from variety and N fertilization trials were used for these analyses, and to subsequently develop predictive models of seed quality.
The results showed that several environmental, agronomic and genetic factors significantly affect seed quality of oilseeds. These factors include region, soil texture, weather conditions (global radiation, precipitation, temperature), variety characteristics (maturity and flowering earliness, flowering duration, plant height, oil and protein potential concentrations), and crop practices (sowing date and density, N-fertilization).
The best-performing model for predicting protein and oil concentration in rapeseed and sunflower seeds was the Random Forest model. The model achieved good predictive accuracy, with over 84% of well-predicted values falling within acceptable ranges for rapeseed seed quality (oil and protein concentrations), and the same for sunflower protein concentration. However, some progress has to be done for sunflower oil concentration, as less than 59% of the situations were satisfactorily predicted.
Résumé
Cette étude a examiné les facteurs influençant la qualité des graines de colza et de tournesol, pour déterminer ceux qui impactent le plus les teneurs en protéines et en huile. Des données historiques provenant d'essais variétaux et de fertilisation azotée ont été utilisées pour ces analyses, et pour développer des modèles prédictifs de la qualité des graines.
Les résultats ont montré que plusieurs facteurs affectent de manière significative la qualité des graines. Ces facteurs comprennent la région, la texture du sol, les conditions climatiques (rayonnement, précipitations, température), les caractéristiques variétales (précocité à maturité et à floraison, durée de floraison, hauteur de la plante, teneurs potentielles en huile et en protéines des graines), et les pratiques culturales (date et densité de semis, fertilisation azotée). Le modèle le plus performant pour prédire la concentration en protéines et en huile des graines de colza et de tournesol était le modèle « Random Forest ». Ce modèle a permis de prédire plus de 84% des valeurs de qualité des graines de colza (teneurs en huile et en protéines), et de teneur en protéines des graines de tournesol. Cependant pour la teneur en huile du tournesol, moins de 59% des valeurs ont été correctement prédites.
Key words: Rapeseed (Brassica napus L.) / sunflower (Helianthus annuus L.) / seed protein concentration / seed oil concentration / random forest / seed quality
Mots clés : Colza (Brassica napus L.) / tournesol (Helianthus annuus L.) / teneur en protéines / teneur en huile / random forest / qualité des graines
Contribution to the Topical Issue: “Diversity of Plant Proteins extracted from Oil & Protein Crop / Diversité des protéines végétales issues des oléoprotéagineux”.
© A. El Msayryb et al., Published by EDP Sciences, 2025
 This is an Open Access article distributed under the terms of the Creative Commons Attribution License (https://creativecommons.org/licenses/by/4.0), which permits unrestricted use, distribution, and reproduction in any medium, provided the original work is properly cited.
Highlights
A significant database (>1200 trials) was compiled for relating seed quality to environment, management and variety in rapeseed and sunflower
Random Forest was the best predicting model of protein and oil concentration on both crops
Seed quality (oil, protein) on rapeseed and seed protein on sunflower were predicted in more than 84% of cases
The prediction of seed oil concentration should be improved in sunflower
1 Introduction
Oilseeds represent a sustainable source of oils and proteins for food and feed (Zhang et al., 2023). Recent market trends are driving the production of oilseeds to significantly higher seed protein concentrations (Arrutia et al., 2020). In rapeseed, industrial processes can create protein ingredients with a particularly attractive amino acid balance (Carré, 2021). They require sourcing rapeseed seeds with protein levels 2 to 3% higher than current French production. The same trend is observed in sunflower: defatted meals are particularly well suited to fish farming and monogastric breeding, provided they achieve high protein concentrations (Pilorgé, 2020). On the other hand, maintaining a marketable oil concentration is also an issue. However, a negative correlation between oil and protein concentrations is generally observed in rapeseed (Grami et al., 1977; Peltonen-Sainio et al., 2010; Kirkegaard et al., 2021) and sunflower seeds (Bauchot and Merrien, 1988; Diepenbrock et al., 2001; Roche, 2005; Andrianasolo et al., 2014; Aguirrezábal et al., 2015). Improving protein levels while maintaining oil concentrations requires genetic improvement and adapted cropping practices (Peltonen-Sainio et al., 2010; Aguirrezábal et al., 2015).
To take full advantage of the more profitable markets demanding high protein concentrations, predictive models of seed protein and oil concentrations are needed in order to assess the potential of territories for producing high-protein oilseeds. Increasing the ability of the different stakeholders (farmers, advisers, commodity traders) to predict protein and oil concentrations at field level prior to harvest could provide a competitive ability to segregate quality and create an economic advantage to better position production in domestic and global markets (Hernandez et al., 2023).
Two types of numerical models are generally used for predicting seed quality at field or regional level: statistical models and process-based models. Multivariate statistical approaches based on linear models (e.g stepwise regression, partial least squares (PLS) regression…) or machine learning tools (artificial neural networks (ANN), random forest regression (RFR), support vector machine (SVM)…) are most often used at regional level by integrating environmental data such as weather and soil data (Porter et al., 1982; Söderstroem et al., 2010; Saruta et al., 2013; Hara et al., 2022; Song et al., 2023). When they assimilate information from remote sensing (drones or satellites), they can be used for in-season prediction and yield forecast (Wang et al., 2014; Hernandez et al., 2023; Longmire et al., 2023; Zhu et al., 2023). Mechanistic crop models can simulate dynamically crop development, growth, yield and grain quality (protein and/or oil concentration) and sometimes the nature of proteins or the amino acid composition (Martre et al., 2006; Aguirrezábal et al., 2015). These models can be applied at field level provided sufficiently accurate information is available on initial conditions, soil characteristics and crop management. These crop growth models are used mostly for unravelling complex Genotype by Environment by Management (G x E x M) relationships, testing some morpho-physiological traits and supporting the agronomic analysis of field experiments. Most of the models either statistical or process-based are intended first for grain yield prediction. The prediction of protein content is often embedded in the models developed for cereals (Asseng and Milroy, 2006; Martre et al., 2006; Beillouin et al., 2018). Recently, Fila et al. (2024) developed a Bayesian hierarchical model to assess the impact of cultivar and weather on total seed oil content and fatty acid composition of linseed. However, to our knowledge, no statistical models have been developed for predicting both protein and oil concentration in oilseeds. A few crop growth models developed for oilseeds include a specific sub-model for predicting seed oil and sometimes protein concentration as a function of variety, environment and crop management (Pereyra-Irujo and Aguirrezábal, 2007; Chen et al., 2015; Casadebaig et al., 2016; Gilardelli et al., 2016; Zanetti et al., 2019). Therefore, models for predicting jointly oil and protein concentrations are lacking for oil-protein crops either at field or regional level.
Both operational and scientific reasons justified why a modelling study was undertaken to develop a predictive tool of seed quality for two major oilseed crops grown in France: rapeseed and sunflower. The first objective was to determine the factors impacting seed quality. The second objective was to carry out modelling in order to set up a predictive tool based on the factors impacting the most seed quality.
2 Materials and methods
2.1 Conceptual model
To better understand the factors affecting the quality of rapeseed and sunflower seeds, we designed a conceptual model from our expertise and the literature integrating all the factors that - to our knowledge - should likely have an impact (Fig. 1).
An initial analysis of these factors will be carried out to check the availability of data in the source databases to reduce the number of influencing factors to be analyzed for modeling.
The two components of rapeseed or sunflower seed quality that will be analyzed and predicted by the model are seed protein concentration on de-oiled dry matter (DDM) and oil concentration to standards, referred to in the rest of the article as “seed quality”. DDM protein concentration was chosen instead of protein concentration on dry matter (DM) to meet the needs of manufacturers who want to know the protein quality of the pressed cake they sell. Oil concentration to standards is measured according to seed marketing standards (9% water and 2% waste).
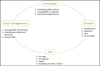 |
Fig. 1 Factors that impact the quality of rapeseed and sunflower seeds. |
2.2 Data used
The seed quality data used in this study came from historical variety and fertilization trials conducted by Terres Inovia from 2008 to 2021 for rapeseed (including 273 varieties in 644 trials) and from 1992 to 2021 for sunflower (including 358 varieties in 599 trials). Variety characteristics were extracted from myVar, a variety decision support system (www.myvar.fr), except for seed quality, as only oil concentration is provided in this tool. Common characteristics for both oilseed crops are : richness in oil (4 classes), flowering and maturity earliness (5 classes), plant height (4 classes), susceptibility to fungal diseases (3-5 classes : phoma and cylindrosporiose for rapeseed; phomopsis, verticillium, orobanche, sclerotinia, mildew for sunflower); additional characteristics are varietal type (3 classes), susceptibility to stem elongation in autumn (5 classes) and richness in glucosinolates (5 classes) for rapeseed and seed size (3 classes) and oil type : oleic vs linoleic for sunflower. Consequently, potential oil and protein concentrations were calculated directly from variety trials to characterize the seed quality of varieties in the model on the basis of trials conducted by Terres Inovia from 2013 to 2021 for rapeseed and from 1991 to 2021 for sunflower.
For fertilization, the difference of N amount between the applied nitrogen dose and the theoretical dose calculated using the N balance sheet method (X dose) was used as an indicator of plant N status (deficiency or excess) as Nitrogen Nutrition Index was not measured. For rapeseed, the percentage of N-fertilizer applied early or lately was also calculated from crop management data.
Soil data, if needed, were extracted from the BDAT (land analysis database) of the French National Institute for Geographic and Forestry Information (IGN, www.gissol.fr).
Information on the soil water holding capacity was not available in most experiments (8% of experiments). To overcome this, we used the Arvalis “Irré-LIS” tool (https://irrelis.arvalisinstitutduvegetal.fr/) to estimate this information indirectly from the location and 5 key soil criteria (depth, texture, stoniness, hydromorphy, presence of limestone). Daily climatic variables were extracted from the Climbox tool developed by Arvalis.
2.3 Statistical methods
To determine the factors affecting the quality of rapeseed and sunflower seeds, the crop growth cycle was divided into several growth phases. Different climatic indicators were calculated for each growth phase (Terres Inovia, 2024 a-b) to determine which one had the greatest impact on seed quality and during which growth phase. For rapeseed, up to 18 growth phases were tested (Fig. S1); for sunflower, only 5 growth phases were tested: 1. Flower Bud (from E1 to F1); 2. Flowering (from F1 to M0); 3. Grain filling (from M0 to M3); 4. “Sowing-E4”; 5. “E4-M0”, E4 corresponding to pre-flowering bud stage (Fig. S2). To do so, we could perform either a multiple linear regression or a PLS (Partial Least Square) regression model. The nature of the indicators (qualitative or quantitative) and the possibility of facing multicollinearity problems between the variables led us choose the PLS regression. PLS handles well this type of problem and is a method that combines principal component analysis (PCA) and multiple linear regression.
At the end of the first PLS procedure, the identified indicators were tested in different predictive models of seed quality. Several models were tested: PLS, Random Forest (Decision Tree Forest), Support Vector Machine (SVM), and Gradient Boosting (GB). 80% of the initial data was used to train the model and 20% was used to test the prediction. A cross-validation system was used to determine the best parameters for each model during the training phase. The R procedures used for running these models are given in Tables S1 to S4.
The prediction accuracy of the models was evaluated by analyzing several statistical criteria. Mean-Squared Error of prediction (MSEp), Root Mean-Squared Error of prediction (RMSEp), and Mean Absolute Error of prediction (MAEp), which measure the mean squared error, its root and the mean absolute error, respectively. Being not in the linear case, R2 was not a criterion to consider. Overall, it is preferable to choose a model with the lowest RMSEp, since this measure weighs large errors more than small ones and favors a model capable of responding to short-term changes. We also selected a forecasting model with the lowest MAEp, as it weighs small and large errors equally, making it robust to outliers. Therefore, it indicates which model has the highest overall prediction accuracy.

where
̂ y = Predicted value for the ith data point
yi = Actual value for the ithdate point
n = Number of observations
The evaluation of the quality of the predicted values was based on the uncertainty ranges of BIPEA (an organization that carries out inter-laboratory comparisons of seed composition) for the analytical methods used to measure seed quality (Nuclear Magnetic Resonance (NMR), near infraRed spectroscopy (NIRS), Soxhlet extraction, etc.): 2.5% for DDM protein concentration and 1% for oil concentration.
Multiple comparisons of DDM protein and oil concentrations means as a function of varietal characteristics and crop management were submitted to HSD Tukey post-hoc test if significant ANOVA.
3 Results and discussion
3.1 Rapeseed
3.1.1 Factors affecting seed quality: variable selection
The first analysis based on expertise and literature brought out 65 variables, including climatic variables, to predict seed quality. A PLS regression model was used on a basis of 11249 individuals, and the parameters with a VIP (Variable Importance in Projection) coefficient > 0.8 were considered important. Correlations between quantitative variables were also analyzed, to keep only the parameters that provide the most information in the PLS model. At last, 18 and 21 variables either numerical or categorical were selected in the models for protein and oil concentrations respectively (Tab. 1).
The location of the trial was integrated into the models by aggregating the data at the level of the Terres Inovia development regions (11 French regions). Soil texture was also considered, and 17 modalities were defined according to the GEPPA diagram (GEPPA, 1963). The variety effects have not been integrated as such but through the parameters that characterize them.
Oil concentration is a complex quantitative trait highly influenced by seed development and environmental conditions in oilseeds (Debaeke and Izquierdo, 2021; Kirkegaard et al., 2021). Seed oil concentration ranged from 34.6% to 49.7% (at standards) and averaged 44.0% over the rapeseed population. This trait is controlled by several genes with an additive effect (Engqvist and Becker, 1991; Attia et al., 2021). DDM seed protein concentration ranged from 30.4% to 53.9% (39.2% on average). A negative correlation between oil and protein concentrations was observed (r = -0.58; n = 9279) for rapeseed which is consistent with the general observations of those two seed components (Grami et al., 1977; Kirkegaard et al., 2021).
Due to the important number of individuals both for DDM protein and oil concentration, varietal characteristics were analyzed through regions, soils and years after ANOVA and multiple comparison test of Tukey (Tab. 2). Hybrid varieties (HR) resulted in a higher DDM protein concentration than inbred lines (+0.9 points on average) whatever the year or region, and vice versa for oil concentration (−0.4 points on average). Varieties with a mid-early to mid-late maturity had a slightly higher DDM protein concentration (+0.6 to 1.1 point on average) than late ones and vice versa for oil concentration (−0.6 to −0.9 points). This effect was similar for earliness at flowering, with a tendency to have higher DDM protein concentration (+0.5 to 0.7 points on average) for early to mid-late flowering varieties, but there was no obvious impact on their oil concentration. The varietal plant height also provided information for the model: the taller the variety, the higher its protein concentration (up to +2.2 points on average), and vice versa for oil concentration (−1.1 points between very tall and short cultivars).
For sowing periods, a tendency was observed for DDM protein concentration to be higher when sowing from August 15 (+2.9 points compared with sowing before this date), and vice versa for oil concentration (−2.2 points).
The N fertilization variables are also important for the predictive quality of the model as an excess of N fertilization can result in lower oil concentration (Zhu et al., 2023). For the deviation from the “a priori X dose” of nitrogen, the trend for DDM protein concentration was upward (r = 0.19), with an opposite trend for oil concentration (r = -0.16). The fraction of N amount applied late from the E stage (i.e., separated flower buds) should theoretically influence DDM protein and oil concentrations, although poor correlations were observed between this variable and seed quality. Excessive N late in the growing season can divert resources from oil synthesis toward protein production, leading to lower oil concentrations.
Radiation, water availability and temperature are well-known determining factors of photosynthesis and biomass accumulation with consequences on oil biosynthesis, N uptake and seed N content in oilseed crops (Debaeke and Izquierdo, 2021; Kirkegaard et al., 2021). Grain yield could act as a limiting factor for the DDM protein concentration, with a tendency observed in the literature to decrease the seed N concentration with the increase in yield (due to a dilution effect) at least among genotypes under the same crop management (Stahl et al., 2017; Kirkegaard et al., 2018).
Selected factors impacting rapeseed seed quality (either DDM protein or oil concentration).
Effect of some varietal and agronomic factors on rapeseed seed quality.
3.1.2 Prediction of DDM protein concentration
The comparison of the prediction accuracy between the four models (PLS, RF, SVM and GB) which integrated the variables of Table 1 was done by calculating the quality criteria mentioned in section 2.3.
Clearly the MSEP, RMSEP, and MAEP criteria are the lowest for the "Random Forest" algorithm (Tab. 3). Therefore, RF is the algorithm that gives the best quality prediction for DDM protein concentration. We split the predicted values into three prediction classes to better visualize the prediction accuracy of this model (Fig. S3a). With this model we get 97.5% of well-predicted values in our reference interval (|prediction-actual| <=2.5%). Only 2.5% of the values used for the prediction test of the RF model were under- or over-predicted.
Model quality criteria for DDM protein concentration prediction: rapeseed.
3.1.3 Prediction of oil concentration
Similarly, for predicting oil concentration, the measured quality criteria indicated that the RF algorithm was the best one (Tab. 4).
Compared to the DDM protein concentration prediction model, the oil concentration prediction model resulted in better RMSEP/MSEP/MAEP criteria values. However, only 84% of well-predicted values were within the reference interval for oil concentration (|prediction-actual |<= 1%) (Fig. S3b). This was explained by the 1% threshold set for oil concentration compared to the 2.5% threshold set for DDM protein concentration. Therefore 16% of the values were under- or overestimated by the model prediction test.
Model quality criteria for oil concentration: rapeseed.
3.1.4 Most influencing variables determining seed quality in rapeseed
The most important variables selected by the RF model were ranked and quantified (Tab. 5)
For both protein and oil concentration predictions, environmental variables such as region (3) and soil type (2) which are integrative of environmental conditions and, for the region factor, of crop management (including variety) were identified as important variables for prediction using RF model. Potential DDM protein (1) and oil (4) concentrations which are related to genetics also appeared as driving variables for seed quality prediction. However, climatic deficit during grain filling (1) was the most important variable for explaining oil concentration while climatic deficit during spring recovery (5) and flowering (8) partly explained the final oil concentration. Climatic deficit during grain filling (4) and from spring recovery to end of flowering or G1 (7) was also important for predicting DDM protein concentration. In addition, sowing date was identified as an important variable for predicting seed quality for both concentrations (5 for protein, 7 for oil). Other variables for protein prediction were N fertilization (6) and grain yield (8) and, for oil prediction, accumulated PAR between flowering and maturity (6).
The PLS regression coefficients were given in Table S5 for rapeseed. The sign of the PLS coefficient reflects the relationship between the predictor and the dependent variable. From the direction of the regression coefficients, it was confirmed that the excess of N fertilization increased DDM protein concentration but decreased oil concentration. Protein concentration was promoted by later sowings while oil concentration was favored by early ones. The radiation became impactful from the beginning of flowering to harvest for the protein concentration (with a very slight tendency to decrease with the increase in radiation), and from vegetative recovery to harvest for oil concentration (with an inverse trend for protein). Increasing PAR during grain filling clearly increased oil concentration in rapeseed. The more days with temperatures above 28 °C, the higher the seed protein increased, with a greater impact during the seed-filling phase. However, increasing temperature had a negative effect on oil concentration.
The analysis of the different growth phases of rapeseed indicates that water deficit has an effect within the model from vegetative recovery until harvest. Water deficit (as figured by P-PET) until the end of flowering could negatively affect DDM protein concentration. For oil concentration, the depressive effect of water deficit was greatest during the silique filling phase, with an inverse trend for seed protein.
However, a slight increase in seed protein concentration was observed after early vegetative and flowering drought treatments by Bouchereau et al. (1996). Taylor et al. (1991) and Champolivier and Merrien (1996) obtained a marked reduction in seed oil concentration when water deficit occurred from anthesis to maturity with an inverse relationship between oil and protein concentration. From the recent meta-analysis of Secchi et al. (2023), short heat and drought stresses at flowering and pod setting would increase protein concentration by 10% and stress during vegetative and seed filling stages would reduce it by 10%. Only short stress at pod setting would have a negative effect on oil concentration. Current scientific literature reports contrasting impacts on the effect of heat and drought for rapeseed productivity (yield and quality), and this is mainly linked to changes in magnitude and duration of the stress between experiments and environments.
Importance of each variable selected by PLS and submitted to the Random Forest model (rank and absolute value of importance between brackets): rapeseed.
3.2 Sunflower
3.2.1 Factors affecting seed quality: variable selection
Starting with 40 variables, the PLS method was also used, as previously. 14 important variables were selected both for protein and oil concentration models. Location and soil texture have been integrated, as for rapeseed (Tab. 6).
Seed oil concentration ranged from 31.5% to 48.5% (at standards) and averaged 44.3% over the analyzed sunflower population (n = 3652). DDM seed protein concentration ranged from 19.5% to 49.2% (32.7% on average, n = 3010). As for rapeseed, a negative correlation between oil and protein concentrations was observed (r = -0.53; n = 2648). This negative correlation between oil and protein concentration has been reported in a wide range of growing conditions (Bauchot and Merrien, 1988; Diepenbrock et al., 2001; Roche, 2005; Andrianasolo et al., 2014; Andrianasolo et al., 2016).
Factors impacting sunflower seed quality.
3.2.2 Prediction of DDM protein concentration
After integrating the 14 parameters listed in paragraph 3.1.2, the quality criteria of the models tested are presented in Table 7.
As for rapeseed, the Random Forest algorithm gave the lowest values for the quality criteria indicating the best quality prediction of the MSD protein concentration.
With this model, 82.8% of the predicted values were within the range of the reference interval (|prediction-actual| <=2.5%). In the data set used to test the prediction of the RF model, 17.2% of values were either under- or over-predicted (Fig. S3c).
Model quality criteria for DDM protein concentration prediction : sunflower.
3.2.3 Prediction of oil concentration
Considering the 14 parameters listed in paragraph 3.1.2, the quality criteria of the models tested are presented in Table 8.
The best predictions for oil concentration were provided by the RF model. However, according to the reference interval set at ±1% (±2.5% for the DDM protein concentration), only 58.8% of the values fell within this interval (Fig. S3d).
Model quality criteria for oil concentration : sunflower.
Importance of each variable selected by PLS and submitted to the Random Forest model (rank and absolute value of importance between brackets): sunflower.
3.2.4 Most influencing variables determining seed quality in sunflower
According to RF model (Tab. 9) the most important variables (1) for seed protein concentration were high temperatures during grain filling (Tmax > 30°C from M0 to M3 stage), then (2) N fertilization (deviation from X dose), (3) potential oil concentration, (4) sowing date and (5) cumulative PAR during grain filling. Oil concentration was mainly determined by (1) potential oil richness, (2) climatic deficit during flowering, (3) sowing date, (4) soil texture and (5) high temperatures (Tmax > 32 °C) during flowering.
The number of days with temperatures above 30°C becomes significant from stage F1 to stage M3 for protein concentration and from sowing for oil concentration with several days with temperatures above 32°C. The more days with high temperatures during the 3 phases of sunflower growth, the higher DDM protein concentration was observed and vice versa for oil concentration (Tab. S6). DDM seed protein was increased by heat stress from E4 (pre-flowering) to maturity (M3). Oil concentration was depressed by high temperatures during flowering but not after this period. Chimenti et al. (2001) also found that very high temperatures (> 34°C) were responsible for a reduction in oil accumulation because of a decrease in grain filling time that resulted in a decrease in kernel weight and in an increase in the hull fraction.
More radiation and water availability led to higher oil concentration but lower DDM protein concentration (Aguirrezábal et al., 2015). This effect was observed throughout the sunflower's growth stages, from early anthesis (F1) to physiological maturity (M3). Seed protein concentration was positively influenced by increased PAR during flowering but negatively hereafter while oil concentration was systematically increased by higher PAR values but especially during grain filling (M0-M3). Water deficit during both flowering and grain filling negatively impacted seed protein and oil concentration.
The same goes for water stress, which impacts the seed quality from F1 to M3 stages. The more water is available, the higher the oil concentration, and vice versa for the DDM protein concentration. This result is consistent with those reported in the literature. Santonoceto et al. (2003) compared four contrasting water regimes in southern Italy, and demonstrated the depressive effect of water limitation during the final stage of oil accumulation. Anastasi et al. (2010) and Alahdadi et al. (2011) observed 13% and 27% more oil with full irrigation than with rainfed sunflowers in southern Italy and Iran, respectively. Several other studies have reported positive effects of supplemental irrigation on oil concentration (Champolivier et al., 2011; Sezen et al., 2011), although the magnitude of the responses depended on natural water availability.
Later planting dates were associated with higher DDM protein concentration and oil concentration according to the analysis (Tab. 2; Fig. S6). However, numerous studies have also concluded that oil concentration was reduced when the sowing date was delayed in the spring (Unger, 1980; Thompson and Heenan, 1994; Goksoy et al., 1998; Flagella et al., 2002; Zheljazkov et al., 2009; Petcu et al., 2010).
Varietal characteristics (potential protein and oil richness and earliness of maturity) have an impact on seed quality in sunflower. Seed protein was logically reduced when potential oil concentration increased and when potential protein concentration decreased. For the oil concentration, this character has a strong genetic heritability but with some influence of environmental factors (Fick, 1978; Andrianasolo et al., 2016). Early-maturing genotypes resulted in higher seed oil while late-maturing varieties where characterized by higher seed protein.
Plant density also emerged as an influencing factor in our model. Low plant densities (< 4 plants.m−2) strongly depressed seed oil concentration. This agrees with the study of Champolivier et al. (2011) who found that low plant densities in farmers' fields were responsible for the low oil concentration observed at the field level. Positive correlations between oil concentration and plant density and between hull (%) and plant density were observed in farmers' fields.
The results obtained in this study for oil concentration prediction outperformed those obtained with other statistical models in sunflower (Andrianasolo et al., 2014; Andrianasolo et al., 2016) as MLR (multiple linear regression, RMSEP = 2.41%), GAM (generalized additive model, RMSEP = 1.95%) or RT (regression tree, RSMEP = 2.95%).
4 Conclusions
Four Random Forest models have been developed to predict the quality of rapeseed and sunflower seeds, based on the factors that impact the most this quality, with promising results. These models incorporate various factors known to influence seed quality, such as soil texture, sowing date, variety, N fertilization and environmental conditions (radiation, temperature, water availability). Generally the interpretation of the effect of the environmental and crop management was consistent with the literature. However, correlations between growing region, sowing date, and variety earliness made more complex the interpretation of individual agronomic factors. Similarly, the buffering effect of the soil (texture, depth) on crop water availability could have modulated the sole representation of water deficit by the P-PET variable, which is above all a climatic variable.
The rapeseed model performed well for both DDM protein and oil concentration. The sunflower model performed acceptably well for DDM protein concentration, but was less satisfactory for oil concentration although it outperformed previous attempts.
In spite of these limitations, the models have the potential to be useful tools for grain storage companies in managing the seed collection campaign. They could be used to assess the potential of territories for producing high-protein oilseeds and enable seed lots to be segregated at harvest time according to their predicted quality.
Collaboration with grain storage companies is required to obtain appropriate data over production areas for further model evaluation. These data will enable us to test the models and to improve the quality of predictions under real production conditions and at more aggregated levels.
Acknowledgments
The authors would like to thank the recovery plan “Cap Protéines” for funding this study as part of the VALOAVAL project, which aims to improve the competitiveness of the French protein industry, and Arvalis for the access to ClimBox.
Funding
This study received financial support from the recovery plan “Cap Protéines” as part of the VALOAVAL co-funded project (Ministry of Agriculture and Food, France Relance and Terres Univia)
Conflicts of interest
The authors have no conflicts of interest to declare that are relevant to the content of this article.
Author contribution statement
Abdellatif El Msayryb: conceptualization; investigation; data curation; methodology; software; formal analysis; visualization; writing – original draft; writing – review and editing.
Luc Champolivier: conceptualization; investigation; methodology; writing – review and editing; resources; funding acquisition; project administration; supervision.
Philippe Debaeke: conceptualization; methodology; writing – original draft; writing – review and editing; supervision.
Francis Flénet: conceptualization; investigation; methodology; writing – review and editing; resources; funding acquisition; project administration; supervision.
Supplementary Material
Figure S1. Main growth stages of rapeseed and definition of the 18 phenological phases (from Terres Inovia, 2024 a).
Figure S2. Main growth stages of sunflower and definition of the 5 phenological phases (from Terres Inovia, 2024 b).
Figure S3. Projection of predicted vs actual values (Random Forest).a) DDM protein concentration: rapeseed.b) Oil concentration: rapeseed.c) DDM protein concentration: sunflower.d) Oil concentration: sunflower.
Table S1. Protein model for rapeseed
Table S2. Oil model for rapeseed.
Table S3. Protein model for sunflower.
Table S4. Oil model for sunflower.
Table S5. PLS regression coefficients for DDM protein concentration and oil concentration to standards : rapeseed.
Table S6. PLS regression coefficients for DDM protein concentration and oil concentration to standards : sunflower.
Access Supplementary MaterialReferences
- Aguirrezábal L., Martre P., Pereyra-Irujo G., Echarte M.M., Izquierdo N.. 2015. Improving grain quality: ecophysiological and modeling tools to develop management and breeding strategies. In: Sadras V.O. &, Calderini D.F., eds. Crop physiology: applications for genetic improvement and agronomy. London (UK): Academic Press, 2015, pp 423–465. https://doi.org/10.1016/B978-0-12-417104-6.00017-0. [Google Scholar]
- Alahdadi I., Oraki H., Parhizkar Khajani F.. 2011. Effect of water stress on yield and yield components of sunflower hybrids. Afr J Biotechnol 10: 6504–6509. https://doi.org/10.5897/AJB11.035. [Google Scholar]
- Anastasi U., Santonoceto C., Giuffre A.M., Sortino O., Gresta F., Abbate V.. 2010. Yield performance and grain lipid composition of standard and oleic sunflower as affected by water supply. Field Crops Res 119: 145–153. https://doi.org/10.1016/j.fcr.2010.07.001. [CrossRef] [Google Scholar]
- Andrianasolo F.N., Casadebaig P., Maza E., Champolivier L., Maury P., Debaeke P.. 2014. Prediction of sunflower grain oil concentration as a function of variety, crop management and environment using statistical models. Eur J Agron 54: 84–96. https://doi.org/10.1016/j.eja.2013.12.002. [CrossRef] [Google Scholar]
- Andrianasolo F.N., Debaeke P., Champolivier L., Maury P.. 2016. Analysis and modelling of the factors controlling seed oil concentration in sunflower: a review. OCL 23(2): D206. https://doi.org/10.1051/ocl/2016004. [CrossRef] [EDP Sciences] [Google Scholar]
- Arrutia F., Binner E., Williams P., Waldron K.W.. 2020. Oilseeds beyond oil: press cakes and meals supplying global protein requirements. Trends Food Sci Technol 100: 88–102. https://doi.org/10.1016/j.tifs.2020.03.044. [CrossRef] [Google Scholar]
- Asseng S., Milroy S.P.. 2006. Simulation of environmental and genetic effects on grain protein concentration in wheat. Eur J Agron 25: 119–128. https://doi.org/10.1016/j.eja.2006.04.005. [CrossRef] [Google Scholar]
- Attia Z., Pogoda C.S., Reinert S., Kane N.C., Hulke B.S.. 2021. Breeding for sustainable oilseed crop yield and quality in a changing climate. Theor Appl Genet 134: 1817–1827. https://doi.org/10.1007/s00122-021-03770-w. [CrossRef] [PubMed] [Google Scholar]
- Bauchot A., Merrien A.. 1988. Teneur en protéines des graines de tournesol et état protéique foliaire: revue bibliographique. Inf. Tech. CETIOM 102: 18–28. [Google Scholar]
- Beillouin B., Leclère M., Barbu C.M., Bénézit M., Trépos R., Gauffreteau A., Jeuffroy M.H. 2018. Azodyn-Barley, a winter-barley crop model for predicting and ranking genotypic yield, grain protein and grain size in contrasting pedoclimatic conditions. Agr For Meteorol 262: 237–248. https://doi.org/10.1016/j.agrformet.2018.06.002. [CrossRef] [Google Scholar]
- Bouchereau A., Cloassais-Bernard N., Bensaoud A., Leport L., Renard M.. 1996. Water stress effects on rapeseed quality. Eur J Agron 5: 19–30. https://doi.org/10.1016/S1161-0301(96)02005-9. [CrossRef] [Google Scholar]
- Cappelli G., Zanetti F., Ginaldi F., Righini D., Monti A., Bregaglio S.. 2019. Development of a process-based simulation model of camelina seed and oil production: a case study in Northern Italy. Ind Crop Prod 134: 234–243. https://doi.org/10.1016/j.indcrop.2019.03.046. [CrossRef] [Google Scholar]
- Carré P.. 2021. Reinventing the oilseeds processing to extract oil while preserving the protein. OCL 28: 13. https://doi.org/10.1051/ocl/2021001. [CrossRef] [EDP Sciences] [Google Scholar]
- Champolivier L., Merrien A.. 1996. Effects of water stress applied at different growth stages to Brassica napus L. var. oleifera on yield, yield components and seed quality. Eur J Agron 5: 153–160. https://doi.org/10.1016/S1161-0301(96)02004-7. [CrossRef] [Google Scholar]
- Champolivier L., Debaeke P., Merrien A.. 2011. Pourquoi irriguer le tournesol, une culture réputée tolérante à la sécheresse ? Innov. Agron. 14: 151–164. https://doi.org/10.17180/321k-he38. [Google Scholar]
- Champolivier L., Debaeke P., Thibierge J., 2011. Construire des stratégies de production adaptées aux débouchés à l’échelle du bassin de collecte. Innov Agron 14: 39–57. https://doi.org/10.17180/g5rg-6560. [Google Scholar]
- Chen M., Zhao W., Meng Y., Chen B., Wang Y., Zhou Z., Oosterhuis D.M. 2015. A model for simulating the cotton (Gossypium hirsutum L.) embryo oil and protein accumulation under varying environmental conditions. Field Crop Res 183: 79–91. http://dx.doi.org/10.1016/j.fcr.2015.07.011. [CrossRef] [Google Scholar]
- Chimenti C.A., Hall A.J., Lopez M.S.. 2001. Embryo-growth rate and duration in sunflower as affected by temperature. Field Crops Res 69: 81–88. http://dx.doi.org/10.1016/S0378-4290(00)00135-0. [CrossRef] [Google Scholar]
- Debaeke P., Izquierdo N.G.. 2021. 16 - Sunflower. In: Sadras V.O., Calderini D.F., eds. Crop physiology: case histories for major crops. London (UK): Academic Press, pp 483–517. [Google Scholar]
- Diepenbrock W., Long M., Feil B.. 2001. Yield and quality of sunflower as affected by row orientation, row spacing and plant density. Bodenkultur 52: 29–36. [Google Scholar]
- Engqvist G.M., Becker H.C.. 1991. Relative importance of genetic parameters for selecting between oilseed rape crosses. Heriditas 115: 25–30. https://doi.org/10.1111/j.1601-5223.1991.tb00342.x. [Google Scholar]
- Fick G.N.. 1975. Heritability of oil concentration in sunflowers. Crop Sci 15: 77–78. https://doi.org/10.2135/cropsci1975.0011183X001500010022x. [CrossRef] [Google Scholar]
- Fick G.N.. 1978. Sunflower breeding and genetics. In: Carter J.F., ed. Sunflower science and technology. Madison, WI, USA: Agronomy Monograph 19, ASA-CSSA-SSSA, pp. 279–337. [Google Scholar]
- Fila G., Montanari M., Maestrini C., Bagatta M., 2024. Bayesian analysis of cultivar and climate effects on seed and oil production in linseed. Ind Crop Prod 218: 118883. https://doi.org/10.1016/j.indcrop.2024. 118883. [CrossRef] [Google Scholar]
- Flagella Z., Rotunno T., Tarantino E., Di Caterina R., De Caro A.. 2002. Changes in seed yield and oil fatty acid composition of high oleic sunflower (Helianthus annuus L) hybrids in relation to the sowing date and the water regime. Eur J Agron 17: 221–230. https://doi.org/10.1016/S1161-0301(02)00012-6. [CrossRef] [Google Scholar]
- Geleta S., Baltensperger D.D., Binford G.D., Miller J.F.. 1997. Sunflower response to nitrogen and phosphorus in wheat-fallow cropping systems. J Prod Agric 10: 466–472. https://doi.org/10.2134/jpa1997.0466. [CrossRef] [Google Scholar]
- GEPPA. 1963. Travaux de la commission cartographie. Annexe 4. Expression de la texture des sols, détermination et dénomination de classes en relation avec un diagramme granulométrique. 5 p. [Google Scholar]
- Goksoy A.T., Turan Z.M., Acikgoz E.. 1998. Effect of planting date and plant population on seed and oil yields and plant characteristics in sunflower (Helianthus annuus L). Helia 21(28): 107–115. [Google Scholar]
- Gilardelli C., Stella T., Frasso N., Cappelli G., Bregaglio S., Chiodini M.E., Scaglia B., Confalonieri R. 2016. WOFOST-GTC: a new model for the simulation of winter rapeseed production and oil quality. Field Crop Res 197: 125–132. http://dx.doi.org/10.1016/j.fcr.2016.07. 013. [CrossRef] [Google Scholar]
- Grami B., Baker R.J., Stefansson B.R.. 1977. Genetics of protein and oil content in summer rape: heritability number of effective factors and correlations. Can J Plant Sci 57: 937–943. https://doi.org/10.4141/cjps77-134. [CrossRef] [Google Scholar]
- Hara P., Piekutowska M., Niedbała G.. 2022. Prediction of protein content in pea (Pisum sativum L.) seeds using artificial neural networks. Agriculture 13: 29. https://doi.org/10.3390/agriculture13010029. [CrossRef] [Google Scholar]
- Hernandez C.M., Correndo A., Kyveryga P., Prestholt A., Ciampitti I.A.. 2023. On-farm soybean seed protein and oil prediction using satellite data. Comput Electron Agric 212: 108096. https://doi.org/10.1016/j.compag.2023.108096. [CrossRef] [Google Scholar]
- Kirkegaard J.A., Lilley J.M., Brill R.D., Ware A.H., Walela C.K.. 2018. The critical period for yield and quality determination in canola (Brassica napus L.). Field Crop Res 222: 180–188. https://doi.org/10.1016/j.fcr.2018.03.018. [CrossRef] [Google Scholar]
- Kirkegaard J.A., Lilley J.M., Berry P.M., Rondanini D.P.. 2021. 17 - Canola. In: Sadras V.O., Calderini D.F., eds. Crop physiology: case histories for major crops. London (UK): Academic Press, pp. 519–549. [Google Scholar]
- Longmire A., Poblete T., Hornero A., Chen D., Zarco-Tejada P.. 2023. Estimation of grain protein content in commercial bread and durum wheat fields via traits inverted by radiative transfer modelling from Sentinel-2 timeseries. ISPRS Journal of Photogrammetry and Remote Sensing 206: 49–62. https://doi.org/10.1016/j.isprsjprs.2023.10. 018. [CrossRef] [Google Scholar]
- Martre P., Jamieson P.D., Semenov M.A., Zyskowski R.F., Porter J.R., Triboi E.. 2006. Modelling protein content and composition in relation to crop nitrogen dynamics for wheat. Eur J Agron 25: 138–154. https://doi.org/10.1016/j.eja.2006.04.007. [CrossRef] [Google Scholar]
- Ozer H., Polat T., Ozturk E.. 2004. Response of irrigated sunflower (Helianthus annuus L.) hybrids to nitrogen fertilization: growth, yield and yield components. Plant Soil Environ 50: 205–211. https://doi.org/10.17221/4023-PSE. [CrossRef] [Google Scholar]
- Pan J., Zhu Y., Cao W., Dai T., Jiang D.. 2006. Predicting the protein content of grain in winter wheat with meteorological and genotypic factors. Plant Prod Sci 9: 3, 323–333. https://doi.org/10.1626/pps.9.323. [CrossRef] [Google Scholar]
- Peltonen-Sainio P., Jauhiainen L., Hyövelä M., Nissilä E.. 2011. Trade-off between oil and protein in rapeseed at high latitudes: means to consolidate protein crop status? Field Crops Res 121: 248–255. https://doi.org/10.1016/j.fcr.2010.12.010. [CrossRef] [Google Scholar]
- Pereyra-Irujo G.A., Aguirrezábal LAN. 2007. Sunflower yield and oil quality interactions and variability: Analysis through a simple simulation model. Agric For Meteor 143: 252–265. https://doi.org/10.1016/j.agrformet.2007.01.001. [CrossRef] [Google Scholar]
- Petcu E., Babeanu N., Popa O., Partal E., Pricop S.M.. 2010. Effect of planting date, plant population and genotype on oil concentration and fatty acid composition in sunflower. Roman Agric Res 27: 53–57. [Google Scholar]
- Pilorgé E.. 2020. Sunflower in the global vegetable oil system: situation, specificities and perspectives. OCL 27: 34. https://doi.org/10.1051/ocl/2020028. [EDP Sciences] [Google Scholar]
- Porter M.A., Paulsen G.M., Feyerherm A.M., Milliken G.M.. 1982. Prediction of wheat grain protein content from climatic and edaphic variables. Agron J 74: 1029–1032. https://doi.org/10.2134/agronj1982.00021962007400060022x. [CrossRef] [Google Scholar]
- Roche J.. 2005. Composition de la graine de tournesol (Helianthus annuus L.) sous l’effet conjugué des contraintes agrienvironnementales et des potentiels variétaux, Ph.D. thesis, INP Toulouse. [Google Scholar]
- Santonoceto C., Anastasi U., Riggi E., Abbate V.. 2003. Accumulation dynamics of dry matter, oil and major fatty acids in sunflower seeds in relation to genotype and water regime. Ital J Agron 7: 3–14. [Google Scholar]
- Saruta K., Hirai Y., Tanaka K., Inoue E., Okayasu T., Mitsuoka M.. 2013. Predictive models for yield and protein content of brown rice using support vector machine. Comput Electron Agric 99: 93–100. http://dx.doi.org/10.1016/j.compag.2013.09.003. [CrossRef] [Google Scholar]
- Secchi M.A., Fernandez J.A., Stamm M.J., Durrett T., Vara Prasad P.V., Messina C.D., Ciampitti I.A. 2023. Effects of heat and drought on canola (Brassica napus L.) yield, oil, and protein: a meta-analysis. Field Crops Res 293: 108848. https://doi.org/10.1016/j.fcr.2023.108848. [CrossRef] [Google Scholar]
- Sezen S.M., Yazr A., Kapur B., Tekin S.. 2011. Comparison of drip and sprinkler irrigation strategies on sunflower seed and oil yield and quality under Mediterranean climatic conditions. Agric Water Manag 98: 1153–1161. https://doi.org/10.1016/j.agwat.2011.02.005. [CrossRef] [Google Scholar]
- Söderström M., Börjesson T., Pettersson C.G., Nissen K., Hagner O.. 2010. Prediction of protein content in malting barley using proximal and remote sensing. Precision Agric 11: 587–599. https://doi.org/10.1007/s11119-010-9181-6. [CrossRef] [Google Scholar]
- Song Y., Zheng X., Chen X., Xu Q., Liu X., Tian Y., Zhu Y., Cao W., Cao Q. 2023. Improving the prediction of grain protein content in winter wheat at the county level with multisource data: a case study in Jiangsu Province of China. Agronomy 13: 2577. https://doi.org/10.3390/agronomy13102577. [CrossRef] [Google Scholar]
- Stahl A., Pfeifer M., Frisch M., Wittkop B., Snowdon R.J.. 2017. Recent genetic gains in nitrogen use efficiency in oilseed rape. Front Plant Sci 8: 963. https://doi.org/10.3389/fpls.2017.00963. [CrossRef] [PubMed] [Google Scholar]
- Steer B.T., Coaldrake P.D., Pearson C.J., Canty C.P.. 1986. Effects of nitrogen supply and population density on plant development and yield components of irrigated sunflower (Helianthus annuus L.). Field Crops Res 13: 99–115. https://doi.org/10.1016/0378-4290(86)90014-6. [CrossRef] [Google Scholar]
- Taylor A.J., Smith C.J., Wilson I.B.. 1991. Effect of irrigation and nitrogen fertilizer on yield, oil content, nitrogen accumulation and water use of canola (Brassica napus L.). Fert Res 29: 249–260. https://doi.org/10.1007/BF01052393. [CrossRef] [Google Scholar]
- Terres Inovia. 2024a. Guide de culture – Colza. Terres Inovia, Thiverval-Grignon, 51 p. [Google Scholar]
- Terres Inovia. 2024b. Guide de culture – Tournesol. Terres Inovia, Thiverval-Grignon, 35 p. [Google Scholar]
- Thompson J.A., Heenan D.P.. 1994. Effect of sowing time on growth, yield, and oil characteristics of irrigated sunflower in southern New-South-Wales. Aust J Exp Agric 34: 255–258. https://doi.org/10.1071/EA9940255. [CrossRef] [Google Scholar]
- Unger P.W.. 1980. Planting date effects on growth, yield, and oil of irrigated sunflower. Agron J 72: 914–916. https://doi.org/10.2134/agronj1980.00021962007200060012x. [CrossRef] [Google Scholar]
- Wang L., Tian Y., Yao X., Zhu Y., Cao W.. 2014. Predicting grain yield and protein content in wheat by fusing multi-sensor and multi-temporal remote-sensing images. Field Crops Res 164: 178–188. http://dx.doi.org/10.1016/j.fcr.2014.05.001. [CrossRef] [Google Scholar]
- Zhang M., Wang O., Cai S., Zhao L., Zhao L.. 2023. Composition, functional properties, health benefits and applications of oilseed proteins: a systematic review. Food Res Int 171: 113061. https://doi.org/10.1016/j.foodres.2023. 113061. [CrossRef] [PubMed] [Google Scholar]
- Zheljazkov V.D., Vick B.A., Baldwin B.S., Buehring N., Astatkie T., Johnson B.. 2009. Oil concentration and saturated fatty acids in sunflower as a function of planting date, nitrogen rate, and hybrid. Agron J 101: 1003–1011. https://doi.org/10.2134/agronj2009.0011. [CrossRef] [Google Scholar]
- Zhu B., Chen S., Xu Z., Ye Y., Han C., Lu P., Song K. 2023. The estimation of maize grain protein content and yield by assimilating LAI and LNA, retrieved from canopy remote sensing data, into the DSSAT Model. Remote Sens 15: 2576. https://doi.org/10.3390/rs15102576. [CrossRef] [Google Scholar]
- Zhu J., Dai W., Chen B., Cai G., Wu X., Yan G.. 2023. Research progress on the effect of nitrogen on rapeseed between seed yield and oil content and its regulation mechanism. Int J Mol Sci 24: 14504. https://doi.org/10.3390/ijms241914504. [CrossRef] [PubMed] [Google Scholar]
Cite this article as: El Msayryb A, Champolivier L, Debaeke T-P, Flénet F. 2025. Analysis of the factors that influence the quality of rapeseed and sunflower seeds and development of predictive models. OCL 32, 16 https://doi.org/10.1051/ocl/2025008.
All Tables
Selected factors impacting rapeseed seed quality (either DDM protein or oil concentration).
Importance of each variable selected by PLS and submitted to the Random Forest model (rank and absolute value of importance between brackets): rapeseed.
Importance of each variable selected by PLS and submitted to the Random Forest model (rank and absolute value of importance between brackets): sunflower.
All Figures
|
Fig. 1 Factors that impact the quality of rapeseed and sunflower seeds. |
| In the text | |
Current usage metrics show cumulative count of Article Views (full-text article views including HTML views, PDF and ePub downloads, according to the available data) and Abstracts Views on Vision4Press platform.
Data correspond to usage on the plateform after 2015. The current usage metrics is available 48-96 hours after online publication and is updated daily on week days.
Initial download of the metrics may take a while.