")
")
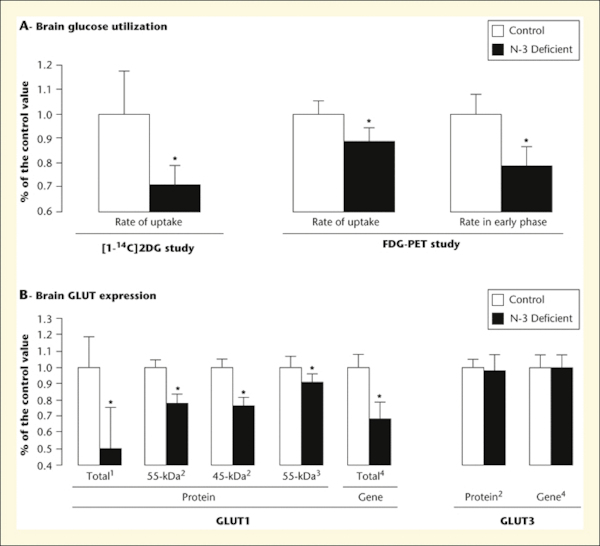
Figure 2.
Download original image
Impact of n-3 PUFA deficiency on glucose utilization (Part A) and GLUT expression (Part B) in the rat brain at rest. Part A. Cerebral glucose utilization was evaluated in the frontal cortex using the semiquantitative autoradiographic [1-14C] 2-deoxyglucose (2DG) method (Ximenes et al., 2002), and in the whole brain using the [18F]-2DG positron emission tomography (FDG-PET) (Harbeby, 2011). The FDG uptake was calculated both during the later plateau and the early phases of the kinetic. Part B. 1 The level of total GLUT1 staining was measured in the fronto-parietal cortex by immunocytochemistry on 30 μm coronal sections (Ximenes et al., 2002). 2 GLUT1 and GLUT3 protein levels were assayed by western blotting on samples of cerebral cortex homogenates (GLUT1 45-kDa and GLUT3) and microvessels (GLUT1 55-kDa) (Pifferi et al., 2005). 3 Quantification of GLUT1 55 kDa was also performed by determining the specific binding of cytochalasin B to GLUT1 on total membranes prepared from isolated microvessels (Pifferi et al., 2007). 4 Level of mRNA expression of GLUT1 gene (Slc2a1) determined by real-time PCR TaqMan Low-Density Array (TLDA) technique (Harbeby et al., 2012). Bars represent means ± SEM (n = 6-8 rats/diet group). * Statistically different from the control rats (P < 0.05).
Current usage metrics show cumulative count of Article Views (full-text article views including HTML views, PDF and ePub downloads, according to the available data) and Abstracts Views on Vision4Press platform.
Data correspond to usage on the plateform after 2015. The current usage metrics is available 48-96 hours after online publication and is updated daily on week days.
Initial download of the metrics may take a while.