")
")
| Issue |
OCL
Volume 33, 2026
Oilseeds and protein crops in Africa: feedback from experience and new perspectives / Les oléoprotéagineux en Afrique : retours d'expérience et nouvelles perspectives
|
|
|---|---|---|
| Article Number | 18 | |
| Number of page(s) | 14 | |
| DOI | https://doi.org/10.1051/ocl/2026010 | |
| Published online | 24 April 2026 | |
Research Article
Sunflower seed yield and quality stabilize across planting dates during hot, dry seasons under rainfed conditions in South Africa☆
En Afrique du sud, le rendement et la qualité du tournesol cultivé sans irrigation sont stables quelle que soit la date de semis en conditions chaudes et sèches
1
Department of Plant and Soil Sciences, University of Pretoria, Private bag X20, Hatfield 0028, South Africa
2
Forestry and Agricultural Biotechnology Institute (FABI), University of Pretoria, Private bag X20, Hatfield 0028, South Africa
3
Department of Geography, Geoinformatics and Meteorology, University of Pretoria, Private Bag X20, Hatfield 0028, South Africa
4
Biotechnology Platform, Agricultural Research Council, Private Bag X05, Onderstepoort 0110, South Africa
5
Department of Biochemistry, Genetics and Microbiology, University of Pretoria, Private bag X20, Hatfield 0028, South Africa
* Corresponding author: This email address is being protected from spambots. You need JavaScript enabled to view it.
Received:
6
November
2025
Accepted:
20
March
2026
Abstract
South Africa is a water-scarce country predominantly practicing dryland agriculture, relying on rainfall onset to determine planting date. Sunflower is commonly considered a substitute crop, planted when primary crops face delayed plantings. The interaction between crop development and environmental variability is critical in Southern Africa because projections indicate warming of up to twice the rate of the global average. We investigated sunflower planting dates and production across two austral summer seasons (2020/2021 and 2021/2022) and two provinces of South Africa. A widely grown cultivar was sown monthly through the summer (from November to March) in a split-plot design. Plant height and leaf number were recorded weekly. Plants were harvested at physiological maturity for morphological and yield assessments. The hotter, drier first season (2020/2021 austral summer) led to the plantings reaching physiological maturity approximately 25 days earlier than in the wetter, cooler season (2021/2022 austral summer). In the hot/dry season, seed yield and quality were lower but more stable across planting dates. In the wetter/cooler second season, there were sharp declines in yield (78.8 g/plant, equivalent to 3.2 tons/ha ) and greater variation in oleic acid (up to 59.9%) across planting dates. These results highlight sunflowers’ stability under hot, dry conditions, supporting their use as a substitute crop.
Résumé
L’Afrique du Sud est un pays confronté à la rareté de l’eau mais pratiquant peu l’irrigation. Ainsi, la date de semis dépend du début des pluies. Le tournesol est souvent considéré comme une culture de substitution quand les semis des cultures principales sont retardés. L’interaction entre le développement des cultures et la variabilité environnementale est critique en Afrique australe, les projections indiquant un réchauffement jusqu’à deux fois plus rapide que la moyenne mondiale. Nous avons étudié les dates de semis et la production du tournesol sur deux saisons d’été austral (2020/2021 et 2021/2022) et dans deux provinces d’Afrique du Sud. Un cultivar largement cultivé a été semé mensuellement durant l’été (de novembre à mars) avec un plan en split-plot. La hauteur des plantes et le nombre de feuilles ont été enregistrés chaque semaine. Les plantes ont été récoltées à maturité physiologique pour des évaluations morphologiques et de rendement. Par rapport à une première saison (été austral 2020/2021) plus humide et plus fraîche, la maturité physiologique était environ 25 jours plus rapide la seconde saison (été austral 2021/2022) plus chaude et plus sèche avec des rendements en graines et qualités plus faibles mais plus stables entre dates de semis. Pour l’année humide et fraîche, il y avait des réductions significatives en rendement (78,8 g/plante, équivalent à 3,2 t/ha) et une plus grande variation de l’acide oléique (jusqu’à 59,9%) entre dates de semis. Ces résultats soulignent la stabilité du tournesol en conditions chaudes et sèches, soutenant son utilisation comme culture de substitution.
Key words: Planting window / water scarcity / heat stress / rainfed / Helianthus annuus L.
Mots clés : fenêtre de semis / rareté de l’eau / stress thermique / agriculture pluviale / Helianthus annuus L.
Contribution to the Topical Issue: “Oilseeds and protein crops in Africa: feedback from experience and new perspectives / Les oléoprotéagineux en Afrique : retours d'expérience et nouvelles perspectives”.
© P. Mapfumo et al., Published by EDP Sciences, 2026
 This is an Open Access article distributed under the terms of the Creative Commons Attribution License (https://creativecommons.org/licenses/by/4.0), which permits unrestricted use, distribution, and reproduction in any medium, provided the original work is properly cited.
Highlights
South Africa is a major sunflower producer in Africa. Southern Africa is warming at twice the rate of the global average, which positions South Africa as a sentinel site for climate change. We show that sunflower is a hardy, adaptable crop that can be used as a substitute under hot, dry conditions when cash crops such as maize or soy are expected to fail.
1 Introduction
There is a wealth of information indicating that climate change will disproportionately affect marginalized communities and developing nations (Levy and Patz, 2015; Coulibaly et al., 2020; Hoffmann et al., 2020). This is particularly true for countries in Southern Africa, where climate projections suggest that the average temperatures are increasing at 1.5−2 times the rate of the global average (Engelbrecht et al., 2015; Engelbrecht and Engelbrecht, 2016). This positions Southern Africa as a global sentinel site—both for what may come as climate change progresses and for testing different agronomic mitigation strategies. Climate shifts are already disrupting global agricultural outputs, with traditionally stable seasonal environments hit hardest (Motta et al., 2025). Despite this, South African agriculture has demonstrated resilience, maintaining yield growth amid high seasonal variability (Mangani et al., 2025a). South Africa’s dynamic and adaptable agricultural practices can provide new insights to support agriculture as the globe prepares for future climates. However, available published data on these African systems remains limited, out-of-date, and inaccessible, which highlights a need for detailed baseline studies.
South Africa is an important agricultural hub in Southern Africa, exporting a significant portion of produce to neighboring countries (Adisa et al., 2018), and is, in this region, the major producer of sunflowers (Pilorgé, 2020), ranking 15th in world production (FAOSTAT, 2022). This crop is the third most important summer grain crop after maize and soybean (SAGIS, 2023) and is mostly grown under dryland conditions in summer rainfall regions between November and January (DAFF, 2010). It is commonly grown as a substitute crop, sown when rainfall onset is delayed past the optimal planting date for soybean or maize (Meyer and van der Burgh, 2015). A climate change projection study across planting dates in major agricultural provinces of South Africa indicated that as climate change progresses, the optimal planting date for dryland maize might shift later (Mangani et al., 2023). Similar studies for soybean and sunflower have not been performed, and there is limited data to support such modeling strategies. This underscores the need for detailed planting date trials, as well as continuous assessment of these trials and agronomic practices as climate change progresses.
Sunflower is considered a fairly resilient crop, tolerant to high temperatures and moderately tolerant to low temperatures (Robinson, 1973; Putnam et al., 1990; DAFF, 2010). Sunflower seeds can germinate at 40 ∘C, but this temperature stunts seedling growth (Gay et al., 1991). Young sunflower seedlings have been reported to tolerate cold temperatures (Putnam et al., 1990; DAFF, 2010) but are very sensitive to freezing temperatures at later developmental stages (DAFF, 2010). When exposed to extremely high temperatures, sunflower plants exhibit reduced growth, as indicated by reduced specific leaf mass and lowered leaf area (De la Haba et al., 2014). Elevated temperatures can reduce oil percentage and seed filling (Rondanini et al., 2003). Persistent temperatures above 34∘C during grain filling reduce grain size, pericarp weight, and quality (Chimenti and Hall, 2001; Rondanini et al., 2003). The choice of planting date is therefore a decisive factor for good performance of the crop when water availability can be a limiting factor (Flagella et al., 2002).
Studies have shown that phenological stages are influenced by planting date, with seedlings from late plantings emerging earlier than early plantings due to varying soil temperatures with adequate soil moisture (Unger, 1980). In other studies, planting date was shown to also influence leaf number, with early plantings recording higher leaf number compared with late plantings where temperatures were generally lower (Ferreira and Abreu, 2001). Temperature was shown to regulate plant growth and development and can be understood through thermal time (∘Cd) calculations. Thermal time is defined as the number of heat units required by a plant to complete a developmental stage (Olivier and Annandale, 1998). While photoperiod can influence sunflower development, particularly flowering time, thermal time remains the primary driver of phenological progression in most sunflower cultivars (Sadras and Hall, 1988; Connor and Sadras, 1992). Late planting dates have also been reported to possess lower protein content due to moisture stress at flowering and grain-filling stages (Mirshekari et al., 2012). It is important to understand how shifting planting dates might misalign plant phenology and environment, putting more sensitive life stages at risk.
In this study, we aimed to generate baseline data that will support future modeling studies or comparative analyses with future planting window studies. We also aim to investigate the effect of planting date across the planting window on sunflower development and yield. We hypothesized that in South Africa, sunflower may be a good alternative to diversify crop rotation in a dry austral summer season due to its resilient nature and a shorter vegetative period. We established planting date trials across the planting window in two different South African provinces over two austral summer seasons and monitored weather parameters, plant physiology, and plant phenology. We measured final biomass and yield parameters for quality and quantity at maturity. The study objectives were (1) to monitor sunflower development and phenological stage at monthly planting dates over the whole planting window and correlate these with observed climatic factors across the austral summer seasons; (2) to investigate the interactions between planting date and climatic factors that may influence morphological traits and yield components or total yield; and (3) to evaluate the interaction of planting date and climatic factors on seed quality across the planting window. Given the global climate change projections for South African agriculture, this study forms a critical baseline against which future sunflower planting date trials can be measured as climate change progresses in the region. This study also provides insight into adaptable agricultural practices to help mitigate losses due to high temperatures or drought.
2 Materials and methods
2.1 Experimental sites
Field experiments were conducted in Pretoria at Innovation Africa @University of Pretoria, Gauteng Province, South Africa (−25.749559, 28.261434). The second site (Potchefstroom site) was at the Agricultural Research Council’s (ARC’s) Grain Crops Unit in Potchefstroom, North West Province, South Africa (−26.729434, 27.082252). The elevation of the Pretoria site is 1327 m above sea level and has a humid subtropical climate, with an average annual rainfall of 706 mm and an average annual temperature of 18∘C (Köppen et al., 2011). The elevation of the Potchefstroom site is 1352 m above sea level (Baier, 1966), and according to Köppen’s classification, it has a Bs-climate (cold, semi-arid steppe climate) with summer rains, annual rainfall averaging more than 600 mm, and an average annual temperature of 17∘C (Köppen et al., 2011). The Pretoria site is dominated by Hutton sandy clay loamy soils, whereas the Potchefstroom soils are classified as Hutton form, ranging from sandy loam to heavy clays (Group, 1991).
2.2 Sunflower cultivar
A single cultivar was selected for this study to limit the variables, as multiple planting dates, locations, and austral summer seasons greatly increase the complexity of the datasets. According to the Pannar catalog and manual, PAN7080 (Corteva, IN, USA) is a medium- to late-maturity conventional sunflower hybrid, which is widely grown and highly adapted to South African regions. The manual states that PAN 7080 requires 68 days to attain 50% flowering, 116 days to reach physiological maturity, and 150–155 days to harvest under ideal conditions. Under rainfed conditions, the optimal plant population is 35,000 to 55,000 plants/ha, with a potential yield of up to 3.5 tons/ha (2022 Product Catalogue; www.pannar.com).
2.3 Experimental design and crop management
Sunflower trials at each site were conducted as a two-way factorial experiment with planting date and austral summer season as treatment factors, arranged in a randomized complete block design with three replicates ( Tab. S1). The site was tilled and leveled for planting, and manual weeding was done to maintain the site. Each plot was arranged in six rows (6 m long), with 25 cm in-row spacing and 90 cm inter-row spacing (Tab. S1). Two seeds were sown per hole, with subsequent thinning to one plant at three weeks post-planting. Seedlings were used to gap-fill failed emergence points, ensuring a uniform population of 40,000 plants/ha (432 plants per plot). Available soil water capacity (ASW) at planting was not determined as water was supplied through irrigation in cases where it did not rain sufficiently for crop establishment (Gebremedhin et al., 2023). Plants were planted at five monthly planting dates from November to March in Pretoria and three planting dates (November, January, and February) in Potchefstroom across the 2020/2021 and 2021/2022 seasons (Tab. S1). In South Africa, this range of planting dates cover the full austral summer season (November–March), starting late spring, spanning the summer, and ending in early autumn. At sowing, 70 kg/ha nitrogen (LAN, Sasol South Africa (PVT) Ltd, Johannesburg, South Africa) and 21 kg/ha phosphorus (Petrow Agri, Cape Town, South Africa) were applied, followed by top dressing with 100 kg/ha nitrogen (LAN) at 28 days after planting, following DAFF (2010) guidelines.
2.4 Climate data
Climate data were obtained from the South African Weather Services for Pretoria and Potchefstroom, focusing on temperature (maximum and minimum) and rainfall during the 2020/2021 and 2021/2022 austral summer seasons. Daily maximum (Tmax) and minimum (Tmin) temperatures ( Tab. S10) were used to calculate thermal time (TT) using the formula (Eq. 1), as described by McMaster and Wilhelm (1997):
 (1)
(1)
Tbase was set at 6∘C (Kiniry et al., 1992) and the optimum temperature was set at 28∘C (Gintsioudis et al., 2024).
In Pretoria, thermal time and rainfall from weeks four to eleven were analyzed weekly. Cumulative rainfall and thermal time from planting to week four were recorded, with subsequent values presented cumulatively. To evaluate the influence of climate factors on sunflower morphological traits, yield, and seed quality, total rainfall and thermal time from sowing to harvest were analyzed to assess the complete sowing-to-harvest period, while phenological development was characterized by tracking the biological cycle from sowing to physiological maturity. Additionally, maximum and minimum temperatures during the period from 50% flowering to harvest were assessed to evaluate effects of temperature on oil quality.
2.5 Plant development and growth measurements
Plant height and leaf number were assessed on five randomly selected plants per replicate (15 plants per planting date) in the middle rows of each plot from week four to week eleven post-planting. Plant height was measured from soil level to the highest growing point of the plant, while leaf number was determined by counting true leaves, which are defined as leaves measuring 4 cm or longer and exclude the cotyledons (Schneiter and Miller, 1981). Emergence duration was calculated as the number of days from planting to 50% emergence, when half of the planted seeds had emerged above the soil surface. Observations were conducted at two-day intervals to identify when 50% of the plant population reached a specific phenological stage (Ahmed et al., 2015). Flowering (R5) was defined when ray florets on the capitulum were fully expanded and visible (Schneiter and Miller, 1981). Physiological maturity (R9) was defined as when the back of the flower head turned from green to yellow-brown and bracts became brown, indicating completion of seed filling (Schneiter and Miller, 1981). Emergence percentage was calculated by dividing the number of emerged seedlings by the total number of seeds planted, then multiplying by 100.
2.6 Yield traits and seed yield
At physiological maturity, five plants per replicate were harvested from the middle rows of the plot to assess seed yield and related traits. These plants were not the same as those monitored for plant height and leaf number. Heads were dried in an air dryer for one week. Head diameter was measured at the widest point, and seeds were manually harvested. Plant debris was removed before seed counting. Seeds from all samples were counted, with filled seeds distinguished from unfilled ones by gently pressing them; unfilled seeds cracked open easily, while filled seeds remained intact. One hundred cleaned, filled seeds were randomly selected per head to determine hundred-seed weight (HSW) using a digital balance (Sartorius, Oakville, Canada). Filled seeds were weighed to calculate seed yield per plant. Three plants per replicate for each planting date were harvested and separated into leaves, stems, and heads. These were bagged and oven-dried at 65∘C for 72 h for the calculation of above-ground biomass and harvest index. Dried sample weights were summed for each replicate. The harvest index was calculated as the ratio of seed yield per plant to average above-ground biomass, multiplied by 100 (Canavar and Kaptan, 2014).
2.7 Oil quality and quantity assessments
Filled seeds were analyzed for oil quantity and quality at the Agricultural Research Council’s Grain Crops Section, Potchefstroom. Seeds from five plants per replicate were pooled into a 140 g sample for analysis. Oil quantity and quality metrics, including protein, linoleic acid, and oleic acid content, were determined using a Perten Diode Array (DA) 7250 NIR analysis system.
2.8 Data analysis
Data from each site were analyzed separately using two-way analysis of variance (ANOVA) with planting date and season as fixed factors in a randomized complete block on various sunflower parameters, including morphological characteristics, harvest index, seed yield per plant, 100-seed weight, oil quantity, protein, linoleic acid, and oleic acid content. For all plant measurements (height, leaf number, head diameter, 100-seed weight, harvest index, seed yield, and seed quality traits), the five plants were sampled per planting replicate and averaged to provide a single value per planting replicate, resulting in three independent replicate observations per planting date (n = 3) as the observational units for statistical analysis. The model fixed and random effects were unselected, as ANOVA assumes that effects are fixed in independent variables. The robust tests of equality of means were done using Welch and Brown–Forsythe (Roth, 1983). A general linear model was used to run univariate analysis, which allows testing for homogeneity and estimates of effect size using Levene’s test of equality of error variances (Draper and Hunter, 1969). The null hypothesis for the Levene’s test was that the error of variance of the dependent variable is equal across groups (Tabs. S2–S9).
To assess the effects of planting date, season, and their interaction on morphological and yield traits, seed yield, and quality, a two-way (factorial) ANOVA was conducted using a general linear model (univariate analysis), with planting date and season as fixed factors and three replicates per planting date-season combination (n = 3). Multiple comparisons of means were performed using Tukey’s honestly significant difference (HSD) test at a 5% significance level. IBM SPSS Statistics version 28.0.1.0 was utilized for one-way ANOVA and univariate analysis. Thermal time calculations were performed using RStudio 2026.01.0+392 version (Team, 2016) with the packages readxl, dplyr (Wickham, 2015), and writexl (Ooms and McNamara, 2023) and are available in Supplementary file. Principal component analysis (PCA) was conducted on endpoint measurements using XLSTAT 2023 (Lumivero, 2023).
3 Results
3.1 Seasonal variation at Pretoria and Potchefstroom
Climate differed markedly between the two austral summer seasons: 2020/2021 was warmer and drier than 2021/2022 at both sites (Fig. S1). In the 2020/2021 season the temperatures remained higher for longer, and the relative humidity declined faster when compared with the 2021/2022 season (Fig. S1). Notably, the Pretoria site experienced a significant heat wave in February 2021 (Fig. S2). There was a marked difference in rainfall between the two austral summer seasons at both sites (Fig. 1), with Pretoria receiving almost half the rainfall in 2020/2021 compared with the 2021/2022 season (Fig. 1a). During grain-filling, Pretoria’s December planting received only 104.1 mm of rainfall in 2020/2021 compared with 218.6 mm in 2021/2022 (Tab. S10). Potchefstroom had extremely high temperatures across 2020/2021, averaging around 35∘C for most of the summer (Fig. S1). Potchefstroom also generally showed drier conditions with lower rainfall across the summer (Fig. 1c). These data highlight the two contrasting seasons assessed in this study, with 2020/2021 representing the hotter, drier season at both sites and 2021/2022 representing the cooler, wetter season at both sites. Despite the temperature differences between the 2020/2021 season and 2021/2022 in Pretoria, in general, thermal time accumulation did not change, with a steady decrease for later planting dates as expected (Fig. 1b). In Potchefstroom, there was a marked difference in thermal time accumulation on the January planting date in 2020/2021 when compared with 2021/2022 (Fig. 1d). Unfortunately, excessive rainfall prevented establishment of the December 2021 planting at Potchefstroom, and so a full comparison could not be made with the preceding planting date.
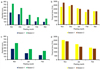 |
Fig. 1 Total or austral summer seasonal rainfall (a and c) and thermal time (b and d) for Pretoria (a and b) and Potchefstroom (c and d) sites for the 2020/2021 (Season 1) and 2021/2022 (Season 2) seasons across planting dates. Planting dates at both sites included November (Nov), January (Jan), and February (Feb); additionally, at the Pretoria site, December (Dec) and March (Mar) were included. Total rainfall and thermal time (Tbase = 6∘C, Topt = 28∘C) represent the complete sowing-to-harvest period per planting date. |
3.2 Thermal time lower in hotter, drier seasons and shifts phenology
Emergence rates were generally influenced by seasonal variation and the hot, dry (2020/2021) austral summer season, with the November (98%) and March (96.3%) plantings exhibiting the highest emergence percentages (Tab. 1). The hottest month that included a heat wave near the time of the February planting date (Fig. S2) had the lowest germination percentage (Tab. 1), likely due to heat stress. Overall, the wet, cool (2021/2022) season generally showed lower germination percentages but less variability across planting dates. The November and March dates again yielded the highest emergence in this season, while the December planting recorded the lowest at 56.7% (Tab. 1). The generally lower emergence percentages likely reflect waterlogging or fungal damage due to the cooler, wet conditions. Overall, the days to emergence showed minimal variation across planting dates and austral summer seasons, ranging from 4 to 7 days with an average of 5 days regardless of season (Tab. 1). The shortest days to emergence for December 2021/2022 coincide with the lowest germination percentage for this season (Tab. 1) and likely highlight stress conditions due to high moisture availability.
Days to 50% flowering varied by planting date, with December plantings reaching flowering fastest (∼65 days) in both seasons as expected, while February plantings required at least one week longer (Tab. 2). Interestingly, despite the generally higher temperatures for the 2020/2021 season at 50% maturity, the November and December planting dates accumulated less thermal time when compared with the same planting dates in the 2021/2022 season (Tab. 2). In the hot, dry 2020/2021 season during flowering, the November and December planting dates accumulated the highest thermal time (1071.63−1013.67∘Cd), while January and February planting dates of the same season had similar thermal times (Tab. 2). This shifted at maturity, where the January planting date had a similar (1442.65∘Cd) thermal time to the November and December planting dates. This trend was not observed in the second wetter, cooler season, where there was a systematic decline in thermal time as planting date was delayed (Tab. 2). Regardless of season, the January, February, and March planting dates accumulated the same thermal time.
Emergence percentages and days to emergence across planting dates for the austral summer seasons (2020/2021 and 2021/2022) at the Pretoria site.
Phenological stages of sunflower plants sown on different planting dates during the austral summer seasons (2020/2021 and 2021/2022) in Pretoria.
3.3 Plant height and leaf number decrease under adverse conditions
Plant height and leaf number were monitored weekly to document growth trajectories, which are rarely reported in sunflower studies (Fig. 2 and Figs. S3–S6). In general, plant height and leaf number showed the characteristic sigmoidal curves expected for tall row crop species (Fig. 2). As expected, the very late March planting date showed a deviation from this pattern, being the slowest to mature in most cases (Figs. S3–S6). However, some interesting insight into the effect of seasonal variations can be observed in this result. In the wetter, cooler 2021/2022 season, the January planting date showed the same developmental patterns when compared with the November, December, and February planting dates (Fig. 2c and d). In the hotter, drier 2020/2021 season, the January planting date showed significantly slower maturation and was significantly shorter (20 cm) than the November, December, and February plantings in the same austral summer season (Fig. 2a and b and Figs. S3–S6). A heat wave experienced in February 2021 (Fig. S2) occurred when the January planting date was at week 4 and was very sensitive to heat stress. Together, this suggests the January plants were stunted by this heat stress event and were unable to recover in terms of growth and development.
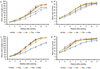 |
Fig. 2 Plant height (a and c) and leaf number (b and d) for the 2020/2021 (a and b) and the 2021/2022 (c and d) seasons for five planting dates: November (Nov), December (Dec), January (Jan), February (Feb), and March (Mar) at the Pretoria site. The period presented is from week four to week eleven after planting. Asterisks (*) indicate where lines are significantly different from other planting dates using one-way ANOVA with a P-value at 0.05, and error bars represent standard errors with n = 15. |
3.4 Final morphological traits shift by austral summer season, planting date, and location
Principal component analysis (PCA) revealed distinct site-specific patterns in morphological trait relationships. The first two principal components captured 82%–88% of total variance across sites and seasons (Fig. 3), with morphological traits (plant height, leaf number, and head diameter) generally showing positive correlations. The Pretoria site exhibited minimal morphological differentiation among planting dates, with treatments clustering closely together except for the March 2021/2022 planting (Fig. 3a and b). In contrast, Potchefstroom showed clear separation among planting dates, indicating stronger planting date effects on final morphology (Fig. 3c and d). These contrasting patterns demonstrate that morphological responses to planting date and season are site-specific, with Potchefstroom showing greater overall morphological variability than Pretoria. We observed that the Potchefstroom site was significantly warmer in the 2020/2021 season (Fig. S1), which is likely contributing to the variation observed at this site.
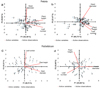 |
Fig. 3 Principal component analysis for leaf number, plant height, and head diameter for the austral summer 2020/2021 season and 2021/2022 season at the Pretoria site (a and b) and the Potchefstroom site (c and d). Different numbers represent planting dates: 1: November, 2: December, 3: January, 4: February, and 5: March for the Pretoria site. F1 (y-axis) represents the first principal component, with the highest total variance. F2 (x-axis) represents the second principal component, with the second highest total variance. The red lines represent the active variables (leaf number, plant height, and head diameter), and the blue dots indicate the active observations (individual samples per planting date, n = 3). |
3.5 Late planting dates and hot, dry conditions limit yield and yield traits
In general, as we expected, the HSW and yield declined across planting dates across the austral summer seasons assessed at both locations, as is expected for a planting date trial (Fig. 4, Fig. S7, and Tab. S11). The November plantings consistently produced the highest yields, with the typical progressive yield reductions observed in later plantings (Fig. 4). In the Pretoria 2021/2022 season, November surpassed December, January, February, and March by 15.2 g/plant (approx. 0.61 ton/ha), 31.3 g/plant (approx. 1.3 ton/ha), 48.5 g/plant (approx. 1.8 ton/ha), and 78.8 g/plant (approx. 3.2 ton/ha), respectively (Fig. 4d). Variations in HSW were comparable in the two years (Fig. 4 and Fig. S7). However, yields did not follow the same pattern across planting dates and seasons.
In both Pretoria and Potchefstroom, the yields in the hot, dry 2020/2021 season stabilized at a lower level across the November to January planting dates (Fig. 4 and Fig. S7). There was no significant difference in yields observed across these planting dates and seasons, while in the 2021/2022 season these planting dates were all significantly different (Fig. 4, Fig. S7, and Tab. S11). This yield stability is also reflected in the harvest index, where no significant differences were observed across the 2020/2021 Pretoria planting dates. In Potchefstroom, there was a significant increase in the harvest index for the January planting date; however, there is no December planting date for comparison (Fig. 4, Fig. S7, and Tab. S11). These findings suggest that despite the morphological shifts observed in the Potchefstroom plants (Fig. 4) or the stunted growth observed in the January plants in Pretoria (Fig. 3), sunflower was able to adapt and compensate for these to maintain yields comparable to earlier planting dates under these hot, dry conditions.
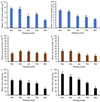 |
Fig. 4 The hundred seed weight (a, d), harvest index (b, e), and seed yield (c, f) for the 2020/2021 (a–c) and 2021/2022 (d–f) austral summer seasons at the Pretoria site. The same letter(s) on top of error bars indicate no significant differences between planting dates using Tukey’s honestly significant difference with P = 0.05; error bars represent standard error, and n = 3 per planting date. |
3.6 Oil quantity and quality is a complex trait influenced by multiple variables
Planting date and seasonal interactions significantly influenced oleic acid and protein content at both locations (Tab. S12). In Pretoria during the 2020/2021 austral summer season, only the March planting date showed significantly lower oleic acid content (∼40%), while protein content remained unchanged across other planting dates (Fig. 5a). No significant differences were observed across planting dates for oil content and linoleic acid content at either site and season (Tab. S12). In the 2021/2022 austral summer season, November and December planting dates in Pretoria produced significantly higher oleic acid content, with December reaching the highest value of 59.9% (Fig. 5c). Conversely, the January planting date recorded the lowest oleic acid content, falling below 50% (Fig. 5g). At Potchefstroom, the interaction between season and planting date also significantly affected oleic acid and protein content, with the January planting date in 2020/2021 yielding oleic acid content above 50% (Fig. 5 and Tab. S11). Across both seasons, protein content generally increased with delayed planting, reaching 17.1% and 15.1% for the February planting dates in the 2020/2021 and 2021/2022 seasons, respectively, likely due to the grain-filling stage coinciding with low minimum temperatures (Fig. 5f and h and Tab. S12). Overall, oleic acid content decreased at late plantings in both seasons and sites except for the Potchefstroom 2021/2022 season, whereas protein content increased at all plantings in both seasons and sites.
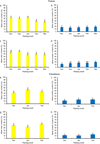 |
Fig. 5 Oleic acid content (a, c) and protein content (b, d) for sunflower plants sown on five planting (November), Dec (December), Jan (January), Feb (February), and Mar (March) in the 2020/2021 (a and b) and 2021/2022 (c and d) austral summer seasons in Pretoria. Oleic acid content (e, g) and protein content (f, h) for sunflower plants sown on three planting dates: Nov (November), Jan (January), and Feb (February) in the 2020/2021 season (e and f) and 2021/2022 (g and h) seasons in Potchefstroom. Similar letters on top of error bars indicate no significant differences between planting dates using Tukey’s HSD test; error bars represent standard error, and n = 3 per planting date. |
Discussion
Our study represents a detailed analysis of sunflower development, morphology, and yield parameters in monthly planting dates across the planting window in two locations under two different austral summer seasons (2020/2021 and 2021/2022). There are limited sunflower planting date studies in South Africa, and most of these studies focus specifically on endpoint analyses and yield parameters and include a limited number of planting dates (De Vos et al., 1985; Ma’ali et al., 2024). Including detailed weekly measurements of growth and development as well as standard morphological and yield parameters ensures this data can be used for an array of modeling studies, including climate change studies. Mangani et al. (2023) used similar baseline data for maize development and downscaled climate models to investigate how climate change might impact maize planting dates in South Africa. Similar studies are lacking for sunflower and soybean, which are also major summer crops in the region. Our data provide a foundation off which to launch similar studies in sunflower, and together with the Mangani et al. (2023) paper, it would enable a greater study of the interactions of cropping systems under climate change. There are very few crop modeling studies or climate modeling studies applied to sunflower (Mangani et al., 2025b), and we envision this data being used to answer a number of key modeling questions in this economically important but comparatively understudied crop.
A limitation of this study was the failure to plant in December 2021 at the Potchefstroom site due to excessive rainfall that prevented mechanized sowing, germination, and ultimately field establishment. While this prevented assessment of year-to-year consistency for the December planting date, the successful evaluation of November, January, and February plantings across both seasons still provided robust data on early versus late planting effects, which were the primary focus of this study. A second limitation is that we only had one hot, dry and one cool, wet season for comparison. This was offset by having two distinct locations and made our comparison clear. However, as climate change continues, it would be valuable to establish long-term trials of this type doing agricultural-level yield estimations and cultivar evaluation. This would enable the monitoring of climate change and the crop’s response over time.
Aside from the expected findings that earlier planting dates generally accumulate more thermal time and produce better (Ferreira and Abreu, 2001; Canavar et al., 2010). Our study clearly demonstrates sunflowers’ ability to adapt to hot, dry conditions and stabilize yields, albeit to moderate levels. We show that under the hot, dry 2020/2021 season, emergence was better for most planting dates except for January and February when compared with the 2021/2022 season (Tab. 1). Sunflower germination is known to be more sensitive to overwatering and oxygen-limiting environments (Gay et al., 1991), and so hotter, drier conditions can improve germination as long as there is sufficient soil moisture.
We also demonstrate that thermal time accumulation in sunflowers is different in planting dates between hot, dry and cool, wet seasons (Tab. 2). For the hot, dry 2020/2021 season, the earliest planting dates (November and December) had the highest thermal time accumulation during the vegetative period when compared with the 2021/2022 season. The January planting date had similar thermal time accumulation when compared across the two austral summer seasons. The thermal time accumulation up to 50% physiological maturity showed an opposite trend, with the November and December planting dates of the cool, wet 2021/2022 season having the highest thermal time accumulation. While the 2020/2021 season showed similar accumulation of thermal time for November, December, and January. Several studies have shown that heat stress during the flowering and grain filling can impact yields (Sadras and Hall, 1988; Rondanini et al., 2003). Our study demonstrates that thermal time accumulation dynamics can explain the lower but stabilized yields we observe (Fig. 5).
The yield parameters we measured mirrored the thermal time accumulation dynamics of the planting dates. In the cool, wet 2021/2022 season, the yields declined steadily from planting date to planting date as expected (Fig. 4). These results are in keeping with studies on sunflower thermal time and yield, where it is documented that sunflower requires 1515 to 1700∘Cd from sowing to maturity (Sadras and Connor, 1988; Connor and Sadras, 1992; Kiniry et al., 1992). However, in the hot, dry 2020/2021 season, this was not the case. The yields for November and December were lower when compared with the 2021/2022 season, but they and the January planting date all stabilized at the same moderate yield. It is likely lower due to lower thermal time accumulation but stabilized nonetheless. This was also supported by the harvest index calculations, which were also stabilized across these planting dates in both locations. These findings are important for South African agriculture because they support the fact that moderate sunflower yields can be attained under hot, dry conditions when rains are late, and this would help offset complete crop failure, which is a common risk under these conditions (Meyer and van der Burgh, 2015). A second important point to highlight for South African farmers is that sunflower is a highly productive crop under optimal conditions and should be planted early. Not only do early plantings improve yields (Fig. 4), but they also limit diseases and the risk of Sclerotinia head rot, which is a major source of yield loss in the South African sunflower industry (Mapfumo et al., 2024).
The plant height and leaf development dynamics revealed that a localized stress event, such as a heat wave, at a specific developmental stage can significantly impact sunflower development (Fig. 2). The Pretoria site was exposed to a heat wave towards the end of February 2021 (Fig. S2). The February planting date had recently been sown, and the germination of this planting date was severely impacted with only a 39% emergence rate (Tab. 1). High-temperature heat damage of the seed membrane results in limited or no germination (Corbineau et al., 2002). However, the plants that did germinate performed well in terms of growth and development (Fig. 2). The January planting date was at week four after emergence during this time, and their growth and development were significantly stunted by this heat wave event. This observation is likely due to elevated temperatures damaging photosynthetic capacity and carbon assimilation (Mirshekari et al., 2012). However, these growth defects did not affect yield of this planting date, which was comparable to the November and December planting dates of the same trial (Fig. 4). Similarly, in Potchefstroom, we observed that the leaf number and plant height were negatively impacted in the 2020/2021 season, but this had little effect on head diameter (Fig. 4). Potchefstroom was extremely hot in the 2020/2021 season (Fig. S2), and yet again, yields between November and December were comparable (Fig. S7). This suggests sunflower possesses compensatory mechanisms during reproductive development that can maintain productivity despite early-season vegetative stress.
Conclusions
This study provides a detailed dissection of the planting window in South Africa by including monthly planting dates and detailed morphological, yield, and growth dynamic measurements. This represents an important data set as climate change progresses and Southern Africa becomes a sentinel site for climate change (Engelbrecht et al., 2015; Scholes and Engelbrecht, 2021). It is predicted that many parts of Europe are warming, and this will result in sunflower crop migration (Debaeke et al., 2017). Our study suggests that South African sunflower cultivars and agricultural practices, including substituting sunflower for other crops in dry years, may provide potential mitigation practices for other sunflower-growing regions globally. Our study, of course, also has significant findings for the South African sunflower production sector. This is the first study to confirm that sunflower is a resilient crop that can adapt to hot, dry conditions and can be used as a substitute crop to obtain moderate yields in years when soybean or maize would likely fail (Meyer and van der Burgh, 2015). We also demonstrate that when sunflower is planted as a primary crop, it should be planted early to maximize yields and limit losses to diseases (Mapfumo et al., 2024). Mangani et al. (2023) predicted that South African austral summers are getting longer as climate change progresses as the first and last frost dates move further apart. With the clear finding that planting sunflowers early maximizes yields, this opens the opportunity to explore double-cropping systems with sunflowers in South Africa in the future and any region globally where long summers are anticipated (Gesch et al., 2022).
Acknowledgments
We would like to express our appreciation for assistance with the fieldwork by Ms. L. Selekelo and her field personnel at Innovation Africa (University of Pretoria), Dr. S. Ma’ali, and Mr. A. Mokhele’s field personnel at the Agricultural Research Council.
Funding
This study was financially supported by the Oil and Protein Seeds Development Trust (OPOT/OAC, https://www.opot.co.za) through student funding and partial research funding.
Conflicts of Interest
All authors declare that they have no conflicts of interest.
Data availability statement
The data that support the findings of this study are available upon request. All data will be available as a supplementary file.
Author contribution statement
Phrasia Mapfumo: Conceptualization, data collection, investigation, statistical analysis, writing of the original draft, writing review, and editing.
Dirk Swanevelder: Conceptualization, data collection, investigation, and writing review and editing.
Emma Archer: Conceptualization, writing review, and editing.
P. Markus Wilken: Conceptualization, writing review, and editing.
Nicky M. Creux: Securing student and research funding, conceptualization, data collection, Investigation, statistical analysis, writing review, and editing.
Ethics approval
All ethics were approved according to the criteria of the University of Pretoria (Reference number: NAS173/2020).
Supplementary Material
Fig. S1. Comparison of temperature and relative humidity parameters across different planting months for two growing seasons (2020/2021 and 2021/2022) at Pretoria and Potchefstroom. (a) Mean maximum temperature (Tmax) and mean minimum temperature (Tmax) across all planting months from November to March (2020/2021). (b) Mean maximum temperature (Tmax) and mean minimum temperature (Tmax) across all planting months from November to March (2021/2022). (c) Mean relative humidity across all planting months from November to March. (d) Mean maximum temperature (Tmax) and mean minimum temperature (Tmax) across all planting months (November, January, and February; 2020/2021). (e) Mean maximum temperature (Tmax) and mean minimum temperature (Tmin) for selected planting months (November, January, and February; 2021/2022). (f) Mean relative humidity for selected planting months (November, January, and February). Temperature values are expressed in degrees Celsius (∘C), and relative humidity is expressed as a percentage (%).
Fig. S2. Daily maximum and minimum temperatures recorded during the month of February 2021, Pretoria site. A heat wave occurred during this period on days highlighted by a light red box. These temperatures coincided with February and January planting dates at emergence and leaf development stages, respectively.
Fig. S3. Statistical analysis of plant height using ANOVA (P-value <0.05) and Tukey’s HSD test for multiple comparisons to test the effects of planting date and weather conditions weekly (from week four to week 11) across five planting dates (2020/2021) for season one at the Pretoria site. Significant differences between planting dates (row by column) with P-values <0.05 are highlighted in green filled blocks.
Fig. S4. Statistical analysis of plant height using ANOVA (P-value <0.05) and Tukey’s HSD test for multiple comparisons to test the effects of planting date and weather conditions weekly (from week four to eleven) across five planting dates for the second season (2021/2022) at the Pretoria site. Significant differences between planting dates (row by column) with P-values <0.05 are highlighted in green filled blocks.
Fig. S5. Statistical analysis of leaf number using ANOVA (P-value <0.05) and Tukey’s HSD test for multiple comparisons to test the effects of planting date and weather conditions weekly (from week four to eleven) across five planting dates for the second season (2020/2021) at Pretoria. Significant differences between planting dates (row by column) with P-values <0.05 are highlighted in green filled blocks.
Fig. S6. Statistical analysis of leaf number using ANOVA (P-value <0.05) and Tukey’s HSD test for multiple comparisons to test the effects of planting date and weather conditions weekly (from week four to eleven) across five planting dates for the second season (2021/2022) at the Pretoria site. Significant differences between planting dates (row by column) with P-values <0.05, are highlighted in green filled.
Fig. S7. The 100-seed weight (a), harvest index (b), and seed yield (c) for the 2020/2021 season; 100-seed weight (d), harvest index (e), and seed yield (f) for the 2021/2022 season at P = 0.05 of Potchefstroom site. The same letters on top of error bars indicate insignificant differences between planting dates using Tukey’s honestly significant difference; error bars represent standard errors and n = 3.
Table S1. Experimental design and trial plant for the 2020/2021 and 2021/2022 field seasons in Pretoria and Potchefstroom in South Africa.
Table S2. Levene’s test of equality of error variances a and b: (a) dependent variable—yield traits and seed yield and (b) design—intercept + planting date.
Table S3. Levene’s test of equality of error variances a and b: (a) dependent variable—yield traits and seed yield and (b) design—intercept + planting date.
Table S4. Levene’s test of equality of error variances a and b: (a) dependent variable—yield traits, seed yield, and seed quality and (b) design—intercept + planting date.
Table S5. Levene’s test of equality of error variances a and b: (a) dependent variable—yield traits and seed yield and (b) design—intercept + planting date.
Table S6. Levene’s test of equality of error variances a and b: (a) dependent variable—seed quality: oil%, protein%, linoleic%, and oleic% and (b) design—intercept + planting date.
Table S7. Levene’s test of equality of error variances a and b: (a) dependent variable—seed quality: oil%, protein%, linoleic%, and oleic% and (b) design—intercept + planting date.
Table S8. Levene’s test of equality of error variances a and b: (a) dependent variable—seed quality: oil%, protein%, linoleic%, and oleic% and (b) design—intercept + planting date.
Table S9. Levene’s test of equality of error variances a and b: (a) dependent variable—seed quality: oil%, protein%, linoleic%, and oleic% and (b) design—intercept + planting date.
Table S10. Total rainfall, mean maximum (Tx), and minimum temperature (Tn) during the grain filling (period from 50% flowering to harvest) stage across planting dates (PD) for two seasons and two locations.
Table S11. Effect of planting date (PD) and seasonal effects on sunflower yield, 100-seed weight, harvest index, and oil quantity and quality at the trial sites Pretoria and Potchefstroom (shaded grey) for the 2020/2021 and 2021/2022 growth seasons.
Table S12. Effects of planting date and weather conditions on total oil and linoleic acid content at trial sites Pretoria and Potchefstroom (shaded grey) for the 2020/2021 and 2021/2022 growth seasons.
Access Supplementary MaterialReferences
- Adisa OM, Botai CM, Botai JO, Hassen A, Darkey D, Tesfamariam E, Adisa AF, Adeola AM, Ncongwane KP. 2018. Analysis of agro-climatic parameters and their influence on maize production in South Africa. Theor Appl Climatol 134: 991–1004. [Google Scholar]
- Ahmed B, Sultana M, Zaman J, Paul SK, Rahman MM, Islam MR, Majumdar F. 2015. Effect of sowing dates on the yield of sunflower. Bangladesh agron J 18(1): 1–5. [Google Scholar]
- Baier W. 1966. Studies on dew formation under semi-arid conditions. Agric For Meteorol 3 (1–2): 103–112. [Google Scholar]
- Canavar Ö, Ellmer F, Chmielewski F. 2010. Investigation of yield and yield components of sunflower (Helianthus annuus L.) cultivars in the ecological conditions of Berlin (Germany). Helia 33(53): 117–130. [Google Scholar]
- Canavar O, Kaptan MA. 2014. Changes in macro and micro plant nutrients of sunflower (Helianthus annuus L.) under drought stress. Scientific Papers. Series A. Agronomy LVII:136–139 [Google Scholar]
- Chimenti C, Hall A. 2001. Grain number responses to temperature during floret differentiation in sunflower. Field Crops Res 72(3): 177–184. [Google Scholar]
- Connor D, Sadras V. 1992. Physiology of yield expression in sunflower. Field Crops Res 30 (3–4): 333–389. [Google Scholar]
- Corbineau F, Gay-Mathieu C, Vinel D, Côme D. 2002. Decrease in sunflower (Helianthus annuus) seed viability caused by high temperature as related to energy metabolism, membrane damage and lipid composition. Physiol Plant 116(4): 489–496. [Google Scholar]
- Coulibaly T, Islam M, Managi S. 2020. The impacts of climate change and natural disasters on agriculture in African countries. Econ Disaster Clim Chang 4: 347–364. [Google Scholar]
- Creux N, du Toit Deon, Mathobisa Theodora, Ceronio Gert. 2022. When is it too late to plant? Avaliable from https://sagrainmag.co.za/2022/11/04/when-is-it-too-late-to-plant/ (last consult: 2025/05/11) [Google Scholar]
- DAFF. 2010. Sunflower production guide. Avaliable from https://opot.co.za/imgs/crops/sunflowers/web-studies/01-agronomy/1-1-production-practices/a-general/sunflower-production-guideline-daff-2010.pdf (last consult: 2025/05/11) [Google Scholar]
- De la Haba P, De la Mata L, Molina E, Agüera E. 2014. High temperature promotes early senescence in primary leaves of sunflower (Helianthus annuus L.) plants. Can J Plant Sci 94(4): 659–669. [Google Scholar]
- Debaeke P, Casadebaig P, Flenet F, Langlade N. 2017. Sunflower crop and climate change: vulnerability, adaptation, and mitigation potential from case-studies in Europe. OCL 24(1): 15. [Google Scholar]
- De Vos R, Dreyer J, Lea J. 1985. Effect of planting date on the phenology, seed yield, and fatty acid composition of three sunflower (Helianthus annuus L.) cultivars. S Afr J Plant Soil 2(4): 207–210. [Google Scholar]
- Draper NR, Hunter WG. 1969. Transformations: some examples revisited. Technometrics 11(1): 23–40. [Google Scholar]
- Engelbrecht CJ, Engelbrecht FA. 2016. Shifts in Köppen-Geiger climate zones over southern Africa in relation to key global temperature goals. Theor Appl Climatol 123:247–261. [Google Scholar]
- Engelbrecht F, Adegoke J, Bopape M-J, Naidoo M, Garland R, Thatcher M, McGregor J, Katzfey J, Werner M, Ichoku C. 2015. Projections of rapidly rising surface temperatures over Africa under low mitigation. Environ Res Lett 10(8): 085004. [Google Scholar]
- FAOSTAT. 2022. Crop and livestock statistics. Avaliable from https://openknowledge.fao.org/server/api/core/bitstreams/0c372c04-8b29-4093-bba6-8674b1d237c7/content (last consult: 2025/05/11) [Google Scholar]
- Ferreira A, Abreu F. 2001. Description of development, light interception and growth of sunflower at two sowing dates and two densities. Math Comput Simul 56 (4–5): 369–384. [Google Scholar]
- Flagella Z, Rotunno T, Tarantino E, Di Caterina R, De Caro A. 2002. Changes in seed yield and oil fatty acid composition of high oleic sunflower (Helianthus annuus L.) hybrids in relation to the sowing date and the water regime. Eur J Agron 17(3): 221–230. [CrossRef] [Google Scholar]
- Gay C, Corbineau F, Côme D. 1991. Effects of temperature and oxygen on seed germination and seedling growth in sunflower (Helianthus annuus L.). EEB 31(2): 193–200. [Google Scholar]
- Gebremedhin T, Haile GG, Gebremicael T, Libsekal H, Reda KW. 2023. Balancing crop water requirements through supplemental irrigation under rainfed agriculture in a semi-arid environment. Heliyon 9(8): 1–12. [Google Scholar]
- Gesch R, Mohammed Y, Walia M, Hulke B, Anderson J. 2022. Double-cropping oilseed sunflower after winter camelina. Ind Crops Prod 181:114811. [Google Scholar]
- Gintsioudis I, Danalatos GJ, Bartzialis D, Giannoulis KD, Danalatos NG. 2024. Accumulated thermal units method for predicting development stages, and potential seed yield of sunflower (Helianthus annuus) under Mediterranean conditions. Ind Crops Prod 221:119383. [Google Scholar]
- Group S. 1991. Soil classification: a taxonomic system for South Africa. Dep. of Agric. Development, Pretoria, South Africa. Avaliable from https://www.fertasa.co.za/wp-content/uploads/2023/08/1.3-Soil-classification-MHTMPHRB-Final.pdf (last consult: 2025/05/11) [Google Scholar]
- Hoffmann R, Dimitrova A, Muttarak R, Crespo Cuaresma J, Peisker J. 2020. A meta-analysis of country-level studies on environmental change and migration. Nat Clim Change 10(10): 904–912. [Google Scholar]
- Kiniry J, Blanchet R, Williams J, Texier V, Jones C, Cabelguenne M. 1992. Sunflower simulation using the EPIC and ALMANAC models. Field Crops Res 30 (3-4): 403–423. [Google Scholar]
- Köppen W, Volken E, Brönnimann S. 2011. The thermal zones of the earth according to the duration of hot, moderate and cold periods and to the impact of heat on the organic world (Translated from: Die Wärmezonen der Erde, nach der Dauer der heissen, gemässigten und kalten Zeit und nach der Wirkung der Wärme auf die organische Welt betrachtet, Meteorol Z 1884, 1, 215-226). Meteorol Z 20(3): 351–360. [Google Scholar]
- Levy BS, Patz JA. 2015. Climate change, human rights, and social justice. Ann Glob Health 81(3): 310–322. [Google Scholar]
- Lumivero. 2023. XLSTAT statistical and data analysis solution. New York. USA.. [Google Scholar]
- Ma’ali S, Cochrane N, Makgoga W, Erasmus J. 2024. The impact of planting dates and hybrid selection on sunflower seed yield and oil content. S Afr J Plant Soil 41 (1–3): 3–12. [Google Scholar]
- Mangani R, Gunn KM, Creux NM. 2023. Projecting the effect of climate change on planting date and cultivar choice for South African dryland maize production. Agric For Meteorol 341:109695. [Google Scholar]
- Mangani R, Mazarura J, Matlou S, Marquart A, Archer E, Creux N. 2025. The impact of past and current district-level climatic shifts on maize production and the implications for South African farmers. Theor Appl Climatol 156(2): 109. [Google Scholar]
- Mangani, R., Archer, E., Engelbrecht, C., Bellocchi, G., Mukiibi, A., Creux, N.M. (2025). The Impact of Climate Change on Crop Production and Food Security: A South African Perspective. In: Leal Filho, W., Matandirotya, N., Yayeh Ayal, D., Luetz, J.M., Borsari, B. (eds) Climate Change, Food Security, and Land Management. Springer, Cham. [Google Scholar]
- Mapfumo P, Buthelezi S, Archer E, Swanevelder DZ, Wilken PM, Creux N. 2024. In-field climatic factors driving Sclerotinia head rot progression across different sunflower planting dates. Plant Pathol 73(5): 1112–1126. [Google Scholar]
- McMaster GS, Wilhelm W. 1997. Growing degree-days: one equation, two interpretations. Agric For Meteorol 87(4): 291–300. [Google Scholar]
- Meyer, van der Burgh. 2015. The competitivess of the South African sunflower value chain. 28–32. Sabinet. https://hdl.handle.net/10520/EJC172520 [Google Scholar]
- Mirshekari M, Hosseini NM, Amiril R, Zandvakili OR. 2012. Study the effects of planting date and low irrigation stress on quantitative traits of spring sunflower (Helianthus annuus L.). Rom Agric Res 29: 189–199 [Google Scholar]
- Motta C, Naumann G, Gomez D, Formetta G, Feyen L, 2025. Assessing the economic impact of droughts in Europe in a changing climate: A multi-sectoral analysis at regional scale. J Hydrol Reg Stud 59:102296. [Google Scholar]
- Olivier F, Annandale J. 1998. Thermal time requirements for the development of green pea (Pisum sativum L.). Field Crops Res 56(3): 301–307. [Google Scholar]
- Ooms J, McNamara J 2023. Export Data Frames to Excel “xlsx” Format. R package version 1.4. 2. [Google Scholar]
- Pilorgé E. 2020. Sunflower in the global vegetable oil system: situation, specificities and perspectives. OCL 27:34. [EDP Sciences] [Google Scholar]
- Putnam D, Oplinger E, Hicks D, Durgan B, Noetzel D, Meronuck R, Doll J, Schulte E. 1990. Sunflower. Alternative field crops manual. Avaliable from https://www.hort.purdue.edu/newcrop/afcm/sunflower.html (last consult: 2025/05/11) [Google Scholar]
- Robinson R. 1973. Elemental composition and response to nitrogen of sunflower and corn. Agron J 65(2): 318–320. [Google Scholar]
- Rondanini D, Savin R, Hall A. 2003. Dynamics of fruit growth and oil quality of sunflower (Helianthus annuus L.) exposed to brief intervals of high temperature during grain filling. Field Crops Res 83(1): 79–90. [Google Scholar]
- Roth AJ. 1983. Robust trend tests derived and simulated: Analogs of the Welch and Brown–Forsythe tests. J Am Stat Assoc 78(384): 972–980. [Google Scholar]
- Sadras V, Hall A. 1988. Quantification of temperature, photoperiod and population effects on plant leaf area in sunflower crops. Field Crops Res 18 (2–3): 185–196. [Google Scholar]
- SAGIS. 2023. Historic production Information. Avaliable from https://www.sagis.org.za/sagis-historic-information/ (last consult: 2025/05/11) [Google Scholar]
- Schneiter A, Miller J. 1981. Description of sunflower growth stages. Crop Sci 21(6): 901–903. [Google Scholar]
- Scholes R, Engelbrecht F. 2021. Climate impacts in southern Africa during the 21st Century. Report for Earthjustice and the Centre for Envrionmental Rights. Global Change Instiute, University of Witwatersrand. Avaliable from https://cer.org.za/wp-content/uploads/2021/09/Climate-impacts-in-SouthAfrica_Final_September_2021.FINAL_.pdf (last consult 2025/05/11) [Google Scholar]
- Team RC. 2016. R: A language and environment for statistical computing. R Foundation for Statistical Computing, Vienna, Austria. http://www.R-project.org/. [Google Scholar]
- Unger PW. 1980. Planting date effects on growth, yield, and oil of irrigated sunflower 1. Agron J 72(6): 914–916. [CrossRef] [Google Scholar]
- Wickham H. 2015. dplyr: A grammar of data manipulation. R package version 04. 3:p156. [Google Scholar]
Cite this article as: Mapfumo P, Archer E, Swanevelder D.Z.H, Wilken M, Creux N.M. 2026. Sunflower seed yield and quality stabilize across planting dates during hot, dry seasons under rainfed conditions in South Africa. OCL 33: 18. https://doi.org/10.1051/ocl/2026010
All Tables
Emergence percentages and days to emergence across planting dates for the austral summer seasons (2020/2021 and 2021/2022) at the Pretoria site.
Phenological stages of sunflower plants sown on different planting dates during the austral summer seasons (2020/2021 and 2021/2022) in Pretoria.
All Figures
|
Fig. 1 Total or austral summer seasonal rainfall (a and c) and thermal time (b and d) for Pretoria (a and b) and Potchefstroom (c and d) sites for the 2020/2021 (Season 1) and 2021/2022 (Season 2) seasons across planting dates. Planting dates at both sites included November (Nov), January (Jan), and February (Feb); additionally, at the Pretoria site, December (Dec) and March (Mar) were included. Total rainfall and thermal time (Tbase = 6∘C, Topt = 28∘C) represent the complete sowing-to-harvest period per planting date. |
| In the text | |
|
Fig. 2 Plant height (a and c) and leaf number (b and d) for the 2020/2021 (a and b) and the 2021/2022 (c and d) seasons for five planting dates: November (Nov), December (Dec), January (Jan), February (Feb), and March (Mar) at the Pretoria site. The period presented is from week four to week eleven after planting. Asterisks (*) indicate where lines are significantly different from other planting dates using one-way ANOVA with a P-value at 0.05, and error bars represent standard errors with n = 15. |
| In the text | |
|
Fig. 3 Principal component analysis for leaf number, plant height, and head diameter for the austral summer 2020/2021 season and 2021/2022 season at the Pretoria site (a and b) and the Potchefstroom site (c and d). Different numbers represent planting dates: 1: November, 2: December, 3: January, 4: February, and 5: March for the Pretoria site. F1 (y-axis) represents the first principal component, with the highest total variance. F2 (x-axis) represents the second principal component, with the second highest total variance. The red lines represent the active variables (leaf number, plant height, and head diameter), and the blue dots indicate the active observations (individual samples per planting date, n = 3). |
| In the text | |
|
Fig. 4 The hundred seed weight (a, d), harvest index (b, e), and seed yield (c, f) for the 2020/2021 (a–c) and 2021/2022 (d–f) austral summer seasons at the Pretoria site. The same letter(s) on top of error bars indicate no significant differences between planting dates using Tukey’s honestly significant difference with P = 0.05; error bars represent standard error, and n = 3 per planting date. |
| In the text | |
|
Fig. 5 Oleic acid content (a, c) and protein content (b, d) for sunflower plants sown on five planting (November), Dec (December), Jan (January), Feb (February), and Mar (March) in the 2020/2021 (a and b) and 2021/2022 (c and d) austral summer seasons in Pretoria. Oleic acid content (e, g) and protein content (f, h) for sunflower plants sown on three planting dates: Nov (November), Jan (January), and Feb (February) in the 2020/2021 season (e and f) and 2021/2022 (g and h) seasons in Potchefstroom. Similar letters on top of error bars indicate no significant differences between planting dates using Tukey’s HSD test; error bars represent standard error, and n = 3 per planting date. |
| In the text | |
Current usage metrics show cumulative count of Article Views (full-text article views including HTML views, PDF and ePub downloads, according to the available data) and Abstracts Views on Vision4Press platform.
Data correspond to usage on the plateform after 2015. The current usage metrics is available 48-96 hours after online publication and is updated daily on week days.
Initial download of the metrics may take a while.