")
")
| Issue |
OCL
Volume 33, 2026
|
|
|---|---|---|
| Article Number | 11 | |
| Number of page(s) | 16 | |
| Section | Agronomy | |
| DOI | https://doi.org/10.1051/ocl/2026003 | |
| Published online | 17 March 2026 | |
Research article
Characterization of Simmondsia chinensis seeds: radiographic, digital morphometric, and ultrastructural analyses
Caractérisation des graines de Simmondsia chinensis : analyses radiographiques, morphométriques numériques et ultrastructurales
1
Seeds Sector, Department of Agriculture, Federal University of Lavras, Campus Universitário, P.O. Box 3037, Lavras 37200‑900, Minas Gerais, Brazil
2
Jojoba Brasil Negocios Ltda, Belo Horizonte, Brazil
* Corresponding author: This email address is being protected from spambots. You need JavaScript enabled to view it.
Received:
9
August
2025
Accepted:
29
January
2026
Abstract
The identification of morphometric characteristics in seeds is an important tool in the characterization and differentiation of seed lots, used in quality monitoring and control, as well as in the design and selection of equipment in the processing line. Jojoba (Simmondsia chinensis) is an oilseed species considered promising for its high-quality oil, good thermal stability, and diverse industrial uses. The objective of this study was to characterize different lots of jojoba seeds using radiographic images and microscopy, identifying parameters that assist in seed classification and contribute to the development of rapid, accurate, and non-destructive methods for evaluating seed quality in this crop. Radiographic analyses allowed the observation of internal seed structures, which, when complemented with image analyses, revealed polymorphism in size, shape, and gray intensity, highlighting lot 5 with superior performance in structural integrity and physiological quality. These findings were consistent with groupings obtained by the UPGMA method, which also demonstrated clear separation between lots based on morphological characteristics. Scanning electron microscopy supplemented radiographic analysis, providing a morphological basis for the internal attributes visualized. Non-destructive seed analysis techniques, such as X-rays, can be used in the characterization and discrimination of seed lots based on morphological characteristics observed in radiographic images.
Résumé
L’identification des caractéristiques morphométriques des graines constitue un outil important pour la caractérisation et la différenciation des lots de graines. Elle est utilisée pour le suivi et le contrôle de la qualité, ainsi que pour la conception et la sélection des équipements des lignes de traitement. Le jojoba (Simmondsia chinensis) est une espèce oléagineuse considérée comme prometteuse en raison de la haute qualité de son huile, de sa bonne stabilité thermique et de la diversité de ses applications industrielles. L’objectif de cette étude était de caractériser différents lots de graines de jojoba à l’aide d’images radiographiques et de techniques de microscopie, afin d’identifier des paramètres utiles à la classification des semences et de contribuer au développement de méthodes rapides, précises et non destructives pour l’évaluation de la qualité des semences de cette culture. Les analyses radiographiques ont permis l’observation des structures internes des graines. Complétées par des analyses d’images, elles ont mis en évidence un polymorphisme de taille, de forme et d’intensité de gris, le lot 5 se distinguant par de meilleures performances en termes d’intégrité structurelle et de qualité physiologique. Ces résultats sont cohérents avec les regroupements obtenus par la méthode UPGMA, qui ont également montré une séparation nette des lots sur la base de leurs caractéristiques morphologiques.
La microscopie électronique à balayage est venue compléter les analyses radiographiques en apportant une base morphologique aux attributs internes observés. Les techniques d’analyse non destructives des graines, telles que la radiographie par rayons X, peuvent ainsi être utilisées pour la caractérisation et la discrimination de lots de semences à partir de caractéristiques morphologiques observées sur les images radiographiques.
Key words: Jojoba / X-rays analysis / SEM / morphological diversity / Simmondsia chinensis
Mots clés : Jojoba / analyse par rayons X / MEB / diversité morphologique / Simmondsia chinensis
© I.D. Briceño-Pinzón et al., Published by EDP Sciences, 2026
 This is an Open Access article distributed under the terms of the Creative Commons Attribution License (https://creativecommons.org/licenses/by/4.0), which permits unrestricted use, distribution, and reproduction in any medium, provided the original work is properly cited.
Highlights
X-ray testing complemented by digital image analysis allows for a rapid and non-destructive evaluation of the internal structure and quality of jojoba seeds.
Morphometric and grayscale differences were observed in the radiographic images of seeds, which allowed for the distinction and grouping of seed lots with similar or contrasting characteristics, as in the case of lot 5.
Differences in physiological potential between jojoba seed lots reflected the influence of initial quality, handling, processing, and storage of the seeds. Lots 1 and 2 were unviable, while lot 5 stood out with 91% germination.
SEM revealed a conical radicle with longitudinal organization, a firm seed coat with trichomes associated with protection, and cotyledons formed by compact cells, indicative of efficient storage of reserves for germination.
1 Introduction
Jojoba (Simmondsia chinensis (Link) Scheiner) is known as desert gold and wild hazel. The species originates from the desert regions of the southwestern United States and northwestern Mexico and belongs to the main group of angiosperms, taxonomically classified as the only member of the Simmondsiaceae family, which consists of a single genus, Simmondsia Nutt (Köhler, 2003). Jojoba is a dioecious, bushy, perennial plant with slow growth and a dense canopy that can reach up to three meters in height under natural conditions (Al-Obaidi et al., 2017a; Khairi, 2019).
In 2022, the global jojoba market reached a volume of 18,211.4 metric tons, with an estimated value of US$130.8 million, and is projected to grow to 27,025.3 metric tons by 2028 (IMARC GROUP, 2022). The exponential growth in the use of the crop is due to its high-quality oil content, which accounts for between 45 to 55% of its dry weight (Bala, 2020). Jojoba oil behaves like a liquid wax, maintaining stable viscosity even under low temperature conditions, primarily due to its composition of long-chain monoesters, giving it industrial properties such as good lubrication, resistance to high temperatures, and oxidative degradation (Lei and Li, 2015), For this reason, jojoba oil has been converted into a natural-based alternative for use in different industries (Uppar et al., 2024), such as the leather tanning industry (Nashy et al., 2024), as a blend in biodiesel production (El-Seesy et al., 2020).
For pharmaceutical purposes, different uses have been reported (Al-Obaidi, 2019). Jojoba oil is used for coating medicinal preparations and treating acne (Alcaraz et al., 2011), and it exhibits anti-inflammatory, analgesic, and antimicrobial activities (Abdel-Magged et al., 2014; Gad et al., 2021; Khairy et al., 2025). In the cosmetic industry, its application includes the production of hair oil, shampoo, soaps, facial creams, and tanning products, due to its conditioning and emollient properties (Gad et al., 2021). Furthermore, its use as an antimicrobial coating in food packaging has been successfully reported (Mohamed et al., 2025). Additionally, a solid byproduct obtained after oil protection, known as jojoba flour, which is rich in protein, has been shown to be a promising supplementary food in the preparation blends for fish and rabbit diets (Bakr et al., 2025; Mohammady et al., 2025).
In agronomy, studies have been reported aiming at its adaptation to different soil and climatic conditions from its place of origin (Castellanos and Molina, 1990), agronomic management practices (Ash and Cother, 2005) tolerance to salinity, drought, and heat conditions (Hamerlynck and Huxman, 2009), oil production, quality, and composition (Ayerza, 2020), and studies of sexual differentiation between male and female jojoba plants (Al-Obaidi et al., 2017b).
Given its adaptability to water-restricted conditions, jojoba is a promising species that can provide good economic returns in arid regions (Sadek and El-Batran, 2020; Abobatta et al., 2024). However, in the field of seed production and technology, aimed at obtaining and evaluating high-quality propagative plant material, few studies have been reported.
The quality of seeds directly influences germination, seedling vigor, and crop performance in the field, contributing to more efficient and sustainable production (Marcos-Filho, 2020). Seed quality results from the sum of genetic, sanitary, physiological, and physical attributes and is closely related to agricultural production success. In this context, morphometric characteristics such as size, shape, and integrity, which constitute the physical attribute of quality, play an important role and are often associated with seed viability and physiological potential (Medeiros et al., 2020a).
Morphometric characteristics of seeds can be obtained manually or digitally; however, manual or traditional methods tend to be limited, particularly in terms of the number of samples that can be sized and their destructive nature. In addition, data processing is subject to evaluator subjectivity, which can lead to changes in measurement quality and precision (Cervantes et al., 2016).
Computational methods utilizing digital image capture, processing, and analysis technology have emerged as alternatives for automatically quantifying a variety of parameters such as shape and size across a wide range of seeds (Loddo et al., 2023). However, photographic assessments are limited when analyzing internal seed structures. In this context, image processing techniques and X-ray testing have emerged as viable alternatives for analyzing and characterizing oilseed seeds (Medeiros et al., 2020a, Trujillo et al., 2021).
Additionally, scanning electron microscopy (SEM) is an essential tool in ultrastructural studies that seek to understand internal relationships of plant tissues and their interaction with ecological and environmental relevance (Castro et al., 2024). This technique is also applied in identifying various plant taxa based on detailed anatomical analyses, especially of seed coat structures (Ameen et al., 2023).
The observation of micromorphological characteristics enables the distinction between related genera and species. Furthermore, the investigation of the external morphology of seeds through SEM has significantly contributed to tracing phylogenetic relationships (Li et al., 2024), becoming an indispensable tool in studying both widely cultivated species and emerging and expanding cultivation, such as jojoba.
Recent advances in X-ray phenotyping applied to oilseed crops such as castor bean, crambe, sesame, and soybean have primarily focused on the morphological assessment of seed lots or sample means (Carvalho et al., 2010; Nogueira et al., 2017; Ribeiro et al., 2021; Trujillo et al., 2021),This study distinguishes itself by employing an expanded set of morphometric and radiographic descriptors, combined with Otsu-based segmentation, quantitative feature extraction, and direct traceability of gray-level statistics to the individual seed germination outcome, an approach not previously reported for jojoba. In addition, the analytical workflow proposed enables the definition of practical thresholds and a stepwise procedure for lot acceptance or rejection in industrial seed quality control, advancing beyond conventional PCA and clustering pipelines. These aspects position our work as a methodological reference for digital seed phenotyping in jojoba and other emerging oilseed crops, supporting direct traceability of gray scale statistics to individual seed germination outcomes. Thus, the objective of the present research was to characterize different lots of jojoba seeds using radiographic images and microscopy to identify parameters that assist in seed classification and contribute to the development of rapid, accurate, and non-destructive methods for evaluating seed quality in this crop.
2 Material and methods
The experiment was conducted at the Central Laboratory for Seed Research of the Federal University of Lavras (LCPS/UFLA), Lavras, Minas Gerais. For this purpose, five lots of jojoba seeds supplied by Jojoba do Brasil Ltda were evaluated to determine physiological quality through the following tests:
Five commercial seed lots of Simmondsia chinensis were supplied by a single company (Jojoba do Brasil, LTDA., [Belo Horizonte, Minas Gerais, Brazil]). According to the supplier, the lots were produced in the 2023/2024 season and were cleaned and processed following the company’s standard industrial protocol. After processing, the lots were stored in paper bags at 10 °C and 50% (relative humidity) for approximately 30 days until the beginning of the experiment, a timeframe associated with equipment availability and experimental design. No additional chemical treatments were applied by the authors; the seeds were received already cleaned by the company.
For each lot, 100 seeds were initially selected for X-ray imaging (four replicates of 25 seeds). All seeds were visually inspected before imaging. Seeds that were visually cracked, broken, or accidentally damaged during handling were immediately replaced with visually intact seeds from the same lot. Thus, a total of 100 seeds per lot were retained for radiographic analysis. The same radiographed seeds (n = 100 per lot) were then used in the germination test, and a subset of 10 randomly chosen seeds, pooled across lots, was used for SEM. Consequently, SEM results should be interpreted as representative of the genotype-level structural pattern, and not as a basis for quantitative comparisons among seed lots. Throughout image analysis and germination scoring, assessors worked with anonymized lot codes and were blinded to lot identity in order to minimize expectation bias.
Seed moisture content: determined by the oven method as described in the Rules for Seed Analysis (Brasil, 2025). In total, 20 seeds from each lot, divided into four replicates of five seeds each, were weighed in stainless steel capsules and placed in a 105 °C oven for 24 h. Afterward, they were re-weighed to determine the moisture content.
2.1 X-ray test and image processing
To observe seed tissue integrity and characterize jojoba seeds, four replicates of 25 seeds each were separated for each lot. These seeds were affixed to transparent acetate sheets with double-sided tape, evenly spaced and numbered according to their position on the sheet for subsequent identification.
Radiographic images were obtained using the FAXITRON HP MX-20 X-Ray equipment (Faxitron X-ray Corp., Wheeling, IL, USA), operating at 35 kV, 19 s exposure, 47 cm focus-object distance, and 0.3 mA direct current. The detector used by the system is a Hamamatsu digital camera, CMOS technology, with a field of view of 120 × 120 mm. These settings were selected after exploratory pre-tests to provide adequate contrast for sensations, minimize noise, and ensure consistent sharpness of the radiographic images.
Radiographic images obtained in TIFF format were analyzed using ImageJ software (Schneider et al., 2012), employing a scale of 20.4453 pixels/mm. Spatial calibration was performed using a metallic object of known dimensions (20 mm × 8 mm), radiographed under the same experimental parameters as the seeds. The resulting image was imported into ImageJ®, and the “Set Scale” tool was used to determine the spatial relationship based on the pixels corresponding to the actual length of the object: ≈408,906 pixels for 20 mm and ≈163,562 pixels for 8 mm. From this calibration, the scale was defined and applied consistently to all analyzed images.
The RGB images in.TIFF format were converted to 8-bit grayscale (256 tones) (Figs. 1A, and 1B). Then, each image was duplicated and one copy was segmented using Otsu's automatic thresholding method (Otsu, 1979) (Fig. 1C), following the instructions of the software provided by the ImageJ's "Auto Threshold" command. This thresholding was based on the bimodal assumption of the gray histogram for each radiographic image (Supplementary image Fig. 1S, 2S, 3S, 4S and 5S), with manual corrections 1.6% of the total seeds used. The binarized image was used to separate the seeds from the image background. Subsequently, shape and size/feature values were extracted and analyzed (Fig. 1D), as well as mean, median and modal values for grayscale (gray.pixel−1) and integrated density, were extracted and analyzed (Ferreira and Rasband, 2012):
Area: Area of seed selection in square pixels defined by perimeter, expressed in calibrated units (mm2).
Perimeter: Defined as the length of the outer boundary of each seed selection (mm).
Width and height: Smallest and largest distance between points of the rectangle covering the seed selection (mm).
Circularity (Circ): indicates how closely the seed shape resembles a perfect circle, with a maximum value of 1.0 indicating a perfect circle, and approaching 0.0 indicating an elongated shape (scalar value). Calculated by the formula (1):
 (1)
(1)
Aspect ratio (AR): Adjusted ratio of the major and minor axes (2).
 (2)
(2)
Roundness (Round.): indicates how closely the shape resembles a circle when considering its main axis (3). Scalar value from 0.0 to 1.0.
 (3)
(3)
Solidity: Ratio between the actual area of the seed and its convex area (4). Scalar value ranging from 0.0 to 1.0, where values close to 1.0 indicate regular and convex contours, while lower values indicate greater irregularity and concavity in the seed contour.
 (4)
(4)
Mean, minimum (Min), maximum (Max), mode, and median gray values were extracted from the selection, representing the distribution of pixel intensities (gray value range: 0–255 for 8-bit images).
Integrated density (IntDen): Product of the area of the seed or embryo with the mean gray in the seed, belonging to the seed mask (gray. mm2.pixel−1).
Using the width and height variables of the seeds from each lot, the form index (IF) was calculated by the formula: IF = (height / width). Thus, Thus, IF < 1.0 indicates elongated seeds (wider than they are long), IF = 1.0 corresponds to a seed with an approximately spherical shape, and IF > 1.0 indicates seeds with oval/elliptical shapes (Azpeitia et al., 2022).
For seed quality traceability, following the exposure of the seeds to the X-ray equipment, a germination test was performed. For this, seeds from each lot, in 4 replicates of 25 previously numbered and identified seeds, were placed equidistant from each other on two sheets of ‘Germitest’ paper towel, positioned in the upper third of the substrate to allow individual seedling development, then rolled and covered with an additional sheet of paper towel. The germitest paper rolls were moistened with distilled water at 2.5 times their dry weight (Brasil, 2025). The rolls were kept in a BOD-type chamber at 25 °C ± 2 °C, with a photoperiod of 12 h of light and 12 h of darkness for seven days.
Ten days after the germination test was set up, seeds that showed root protrusion > 2.00 mm were classified as germinated. This period is considered sufficient for the development of the primary root and the beginning of the formation of secondary roots, as described by Rost et al. (1977) and Figueiredo (1989). Subsequently, the germinated seeds were photographed with a Nikon D1 digital camera. For improved traceability of the development and quality of the radiographed seeds, the authors of the present study captured images of normal and abnormal seedlings (Fig. 2) at the end of 30 days; however, the data were not quantified.
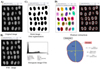 |
Fig. 1 Processing of radiographic images of jojoba seeds. A) RGB image in.tiff format; B) 8-bit grayscale image; C) Otsu thresholded image and histogram; D) extraction of morphometric characteristics. Circ: circularity, AR: aspect ratio, Sold: solidity. |
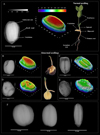 |
Fig. 2 Radiographic images of jojoba seeds. A) Healthy seed with identification of the basic structures that make up the seed, a 3D representation of the gray levels of each pixel, and a normal seedling. Seeds with internal alterations and abnormal seedlings: B) broken seed; C) fruit with two malformed seeds; D) infested seed; E) deteriorated seed. F) spherical, elliptical, and elongated seed shapes. |
2.2 Scanning electron microscopy
For scanning electron microscopy (SEM), ten seeds were randomly selected from the pooled material of the five lots. Because the aim of this analysis was not to compare lots, but to describe the general ultrastructural characteristics of the species/genotype, the selected seeds represent the overall population rather than individual lot identities. Thus, SEM observations are intended to illustrate general seed morphology and internal organization of jojoba, rather than to support lot-wise discrimination.
Each seed was sectioned longitudinally, fixed in Karnovsky’s solution for 24 h, and subsequently transferred to a 30% glycerol solution for 30 min to stabilize tissues. Longitudinal and transverse cuts were then made using a scalpel in the presence of liquid nitrogen to preserve structural integrity and reduce preparation artifacts such as collapse and shrinkage. After cutting, samples were triple-rinsed in distilled water and dehydrated through a graded acetone series (25%, 50%, 75%, and 90% for 10 min each, followed by 100% acetone three times for 10 min).
Samples were dried using a critical-point dryer (Blazers CPD 030), mounted on 12–13 mm stubs with carbon tape over aluminum foil, and metallized with gold in a sputter coater (BALZERS SCD 050). Imaging was performed using a LEO Evo 40XVP operating at 20 kV and a working distance of 10–13 mm. For each seed, multiple micrographs were acquired at variable magnifications to document the morphological structures characteristic of jojoba seeds.
2.3 Statistical analysis and experimental design
The experimental design used was completely randomized, with five treatments (lots) and four replicates each. An analysis of variance was performed for each characteristic, provided that the assumptions of normality (Shapiro-Wilk, p > 0.05) and homogeneity of variances (Bartlett's test) were met. When significant, the data were subjected to one-way mean comparison analysis using Tukey’s test at a 5% significance level. When the assumptions of normality and homoscedasticity were not met, the comparison was performed using the non-parametric Kruskal-Wallis test, and the Bonferroni adjustment method was used for post-hoc multiple comparisons, maintaining an overall error rate (alpha) of 0.05.
To assess whether the morphometric descriptor data obtained from the radiographic images exhibited clustering patterns and variation trends that allow for the differentiation of lots, a principal component analysis (PCA) was performed. For this purpose, a matrix (500×15) was created, corresponding to the standardized data observations for each seed per lot and the respective variables, by z-scores dividing the (centered) columns by their standard deviations.
The independence of the variables was verified using Bartlett's test of sphericity. Meanwhile, the suitability of the data for Principal Component Analysis was assessed using the Kaiser-Meyer-Olkin (KMO) test (Hair et al., 2019)
Hierarchical cluster analysis was performed using the standardized Euclidean distance, and group formation was carried out using the UPGMA method (Unweighted Pair Group Method with Arithmetic Mean), with the results represented in a dendrogram to evaluate the similarity among lots based on radiographic image-derived characteristics. Prior to clustering, the variables were standardized to eliminate scale effects. The number of clusters was initially determined using the Mojena stopping rule applied to the dendrogram. Subsequently, alternative clustering solutions were evaluated using internal validity indices, including the average silhouette width and the Dunn index, in order to assess the robustness and consistency of the selected grouping. The goodness of fit between the dissimilarity matrix and the dendrogram generated by the UPGMA method was validated using the cophenetic correlation coefficient (Sokal and Rohlf, 1962). All analyses were performed using R software (R CORE TEAM, 2021).
3 Results
Initially, the seeds showed an average moisture content of 5.2%, with a maximum variation of 0.6% among the lots, indicating stability of this parameter across the evaluated lots.
Radiographic analyses of seeds from the five jojoba lots revealed details of the internal seed structures (Fig. 2). In addition, a pseudocolor surface representation was generated from the grayscale images to qualitatively visualize variations in X-ray absorbance, where high-contrast color maps were associated with higher grayscale intensity values (red), while low-contrast colors (blue) indicate lower grayscale intensity
Furthermore, the seed coat, cotyledons, and embryonic axis region were identified in the jojoba seeds (Fig. 2A). Various alterations in internal seed tissues were also observed across lots, such as broken seeds (Fig. 2B), jojoba fruit containing two seeds with irregular development (Fig. 2C), seeds with the presence of insect pest larvae consuming the internal tissues and forming galleries as the cotyledonary tissue is consumed (Fig. 2D), and deteriorated seeds with low integrated X-ray density, as indicated in the radiographic image by darker tissues (Fig. 2E). Polymorphism was also observed in the jojoba seeds (Fig. 2F), highlighting spherical, elliptical, and elongated seed shapes.
By applying digital image analysis techniques, attributes were extracted for each seed lot (Tab. 1), which were used to differentiate among the lots (Tab. S1). For size-related characteristics, seeds from lot 5 showed the largest area (121.00±0.70 mm2) and perimeter (48.78±0.69 mm), along with lot 3 (48.52±0.58 mm). As for width, the highest values were observed in lots 3 and 5 (10.00±0.09; and 10.15±0.35 mm, respectively). Meanwhile, seeds from lot 1 exhibited the lowest values for area (106.30±5.27 mm2) and perimeter (47.04±1.39 mm), and, together with lot 1, for width (9.36±0.24 and 9.30±0.24 mm, respectively). Significant differences in seed height were found among the evaluated lots. The lot 5 showed the highest values for seed height, differing significantly from Lot 4 (p = 0.0009), Lot 1 (p = 0.0049) and Lot 2 (p = 0.0057) (Tab. S2).
Regarding shape characteristics, circularity showed significant differences between lots (p < 0.05), with average values ranging from 0.60 to 0.64. These results indicate that the seeds predominantly have a non-circular shape, with subtle variations between the evaluated batch. lot 5 presented the highest average circularity value (0.64), differing significantly from lot 1, which presented the lowest value (0.60), while the other lots presented intermediate values, not differing statistically from each other. Although the form index showed statistically significant differences, it is worth noting that the average shape for seeds in all lots was elliptical. This information was also confirmed by the aspect ratio variable, which indicated the relationship between seed width and height (Tab. 1).
The solidity characteristic describes how compact the seeds are in relation to their contour. The analyses showed significant differences among the lots, with the formation of three statistically similar groups. The first group included lot 5, with a solidity value closer to 1 (0.98±0.0003), indicating more regular and compact edges. Lots 1, 2, and 3 formed the second group. The third group, consisting of lot 4, presented the lowest solidity value (0.975±0.0011), indicating a more irregular surface compared to the other lots. However, it is worth noting that all lots had values above 0.90, suggesting that, overall, the seeds tend to have more compact surfaces with few irregularities or gaps.
Gray intensity was evaluated based on X-ray absorbance values extracted from radiographic images of jojoba seeds, allowing the identification of differences between the analyzed lots. Seeds from lot 5 presented the highest average, maximum, median, and integrated gray intensity values (Tab. 1). These results indicate greater projected attenuation of X-rays, reflected by lighter regions in the image, associated with greater presence and tissue integrity, as well as a greater distribution of pixels with high values compared to the other lots.
The data distribution for length and width was graphically represented using box plot diagrams (Fig. 3), which allowed for the observation of dispersion, central tendency, and outliers in each lot. It was observed that approximately 75% (region below the third quartile) of the length data ranged from 9.73 to 16.141 mm. For the width variable, the observed values ranged from 5.87 to 10.86 mm.
The KMO value obtained (0.703) indicated good sample adequacy. Additionally, Bartlett's test was significant (χ2 = 14336.2; df = 105; p < 0.001), rejecting the identity matrix hypothesis and confirming the existence of significant correlations between the variables, which justifies the application of principal component analysis. The scree plot (Fig. 4A) showed the 15 components extracted in this study. Initially, the figure showed a steep downward slope, until it became an approximately horizontal line, where the inflection point, the elbow, is formed. The cutoff line was established according to Kaiser's criterion, where eigenvalues >1 are considered significant. According to this criterion, four principal components will be retained, and according to the scree plot of the percentages of variance explained (Fig. 4B), the first four components of the model explain 87.1% of the total variability in the original dataset (Fig. 4). Table 2 presents the factor loadings for each principal component, showing the degree of contribution of each original variable to each component.
The first component (PC1) explained the greatest variability in the data, accounting for 38.27% of the total variation. The variables integrated density, median, mean, and mode of gray values, as well as area, were the most important in this first component, as they accounted for most of the variability. However, they contributed negatively to PC1, meaning that high negative values for these variables result in a lower PC1 score, while lower values result in a higher PC1 score.
In the second component (PC2), form index, roundness, and aspect ratio were the most important variables in explaining this component. However, roundness had a negative contribution, indicating that as the value of this characteristic increases, the principal component score decreases.
In the third principal component (PC3), the variables perimeter and width contributed most to the variability, although perimeter contributed positively to the value of this principal component. In the fourth component (PC4), the solidity and circularity variables were the largest contributors to this component.
In addition, the graph allowed the visualization of the distribution of seed lots based on the first two principal components (PC1 and PC2) (Fig. 4C). Each sample from each lot was represented by a specific color, and the ellipses represent the clustering trend for each lot. A concentrated distribution of samples was observed for lot five, allowing for the identification of a clustering pattern for this lot, whereas the samples from the other lots were dispersed throughout the plane.
Principal component analysis performed with individual seeds revealed high intra-lot variability and wide overlap between lots (Fig. 4C), indicating a lack of clear separation at the individual level. This behavior suggests that morphological differences between lots are gradual and better represented by average trends than by individual patterns. Given the high overlap observed in the PCA at the individual level, morphological variables were summarized by lot averages, allowing for the assessment of overall similarity between lots and reducing the influence of intra-lot variability.
The clustering results were evaluated using a dendrogram generated from the standardized Euclidean distance and the UPGMA method. Based on the Mojena stopping rule, the dendrogram revealed two main branches, with two distinct groups at the 6.91 level (Fig. 5), suggesting differentiation among the evaluated lots. The first group consisted exclusively of lot 5, suggesting a distinct morphometric pattern in relation to the other lots. The second group comprised lots 1, 2, 3, and 4, which exhibited greater similarity based on the evaluated radiographic image characteristics.
The internal validity of the clustering solution was assessed using quantitative metrics. The average silhouette width was 0.32, indicating a moderate clustering structure, with most lots presenting positive silhouette values and one lot exhibiting an intermediate pattern between the two groups (Tab. S3). The Dunn index was 1.09, indicating adequate separation between clusters relative to their internal dispersion, thereby reinforcing the structural consistency of the two-cluster solution.
Mean values ± standard deviation for size, shape, and grayscale intensity characteristics extracted from radiographic images of five jojoba seed lots.
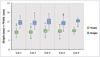 |
Fig. 3 Box plot of height and width distribution in millimeters for jojoba seeds from each evaluated lot. Each box indicates the range between quartiles, the inner line represents the median, and the outer limits correspond to the minimum and maxim um values. The individual points in each box plot represent the outliers. The colors differentiate the two variables analyzed: width (green) and height (blue). |
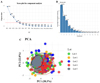 |
Fig. 4 A) Scree plot of the eigenvalues for each extracted component, the red dashed line represents the Kaiser criterion (eigenvalue >1). B) Scree plot of the percentages of variance explained for the first 10 principal components. C) Principal Component Analysis obtained for morphometric data from jojoba seeds (n = 500), showing the distribution of the five lots evaluated. Each point represents an individual seed, colored according to the original lot, and the ellipses indicate the dispersion of the data with a 95% confidence interval for each lot. |
Factor loadings for each variable in the first three components of the PCA.
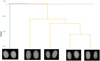 |
Fig. 5 Dendrogram for the classification of five jojoba seed lots based on the UPGMA method. The red dashed line indicates the cutting level defined by Mojena’s rule. The cophenetic correlation coefficient was 0.88. |
3.1 Germination test
The physiological quality of the seeds was evaluated for the five lots using the germination test. After ten days of testing, seeds with radicle protrusion > 2.00 mm were considered germinated. Lots one and two showed no radicle protrusion; therefore, the results for these two lots were not included in the analyses.
Thus, statistically significant differences were observed in the germination test among the three evaluated lots (Fig. 6). Lot five (L5) showed the highest germination percentage at 91%, being grouped into group ‘a’ according to Tukey’s test. Lots three and four (L3 and L4), with averages of 64% and 42%, respectively, were grouped into group ‘b’, indicating lower germination capacity.
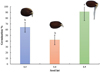 |
Fig. 6 Germination percentage for different lots of jojoba seeds. L3: Lot three, L4: Lot four, L5: Lot five. Different lowercase letters in the bar chart indicate significant differences according to Tukey’s test at the 5% level. Error bars represent the standard error. |
3.2 Scanning electron microscopy
Through scanning electron microscopy (SEM), it was possible to observe that the radicle has a conical morphology, with tissue organized in longitudinal bands (Figs. 7A and 7B). The seed coat of jojoba is firm, with a well-defined structure and the presence of trichomes, structures that may be associated with mechanical protection and interaction with the environment (Figs. 7C–7E). In Figure 7F, the cotyledons are visible, composed of rounded and voluminous cells, compactly organized and compatible with the storage of essential compounds for germination.
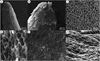 |
Fig. 7 Scanning electron micrograph. A and B) radicle tip; C and D) inner surface of the seed coat; E) outer surface of the seed coat and presence of trichomes; F) cotyledon. |
4 Discussion
In seed quality preservation, determining moisture content is one of the most important factors and is related to the selection of appropriate procedures for evaluating seed quality (Trujillo et al., 2021), such as in conducting radiographic and physiological tests, where uniform moisture content across seed lots is essential to standardize assessments and ensure reliable and promising results (Marcos-Filho, 2020).
The X-ray test has been established as a rapid and non-destructive tool for analyzing oilseeds such as Jatropha curcas (Bianchini et al., 2021), castor bean (Ricinus communis) (Carvalho et al., 2010), crambe (Crambe abyssinica) (Ribeiro et al., 2021), and sesame (Sesamum indicum) (Nogueira et al., 2017). However, its use in evaluating the morphological characteristics of jojoba seeds has not been reported.
The results presented in this study demonstrate the effectiveness of the radiographic test in identifying seeds with internal defects, deterioration, breakage, and insect infestation. The visualization of internal seed structures is based on brightness variations in radiographic images, produced by differences in X-ray absorption by the seed tissues, such as cotyledons, embryo, and seed coat (Brasil, 2025).
Morphometric characteristics of jojoba seeds were quantified through radiographic image analysis, enabling the identification of significant differences across variables among the five evaluated seed lots, allowing them to be grouped into different clusters. Measuring seed dimensions is considered an important step in understanding a species, linked to its identification, propagation, and conservation, both in natural environments and in productive systems (Sánchez et al.,2024). Additionally, it serves as an important agronomic tool, associated with phenotypic traits of the species, yield patterns, productivity, quality, market prices (Cervantes et al., 2016), as well as seed processing and industrial use (El-Emam et al., 2023), especially when aiming to obtain high physical quality seeds, which involves the separation and removal of impurities such as plant debris, clods, weed seeds, and ensures lot standardization (Nogueira and Medeiros, 2007).
Previous studies with jojoba seeds have confirmed their morphometric heterogeneity (Ismail, 1988; Figueiredo, 1989; El-Eman et al., 2023). Measurements of seed length and width (Fig. 3) confirmed the high polymorphism observed in the radiographic images among the different jojoba seed lots. El-Emam et al. (2023) reported width variations between 5.60 and 10.60 mm and length variations between 13.70 and 20.00 mm for jojoba seeds. The ratio between two dimensions is widely used to determine seed shape (Cervantes et al.,2016), as in crops such as Jatropha curcas (Saadaoui et al., 2015), sunflower (Soroka et al., 2017), soybean (Duc et al., 2023), snap bean (Balkaya and Odabas, 2002), and Prosopis laevigata (Azpeitia et al., 2022).
The results of this research made it possible to determine the elliptical shape of the seeds, which can be considered predominant in jojoba. However, other studies have reported distinct morphological patterns, such as oval, spherical, elliptical, or elongated shapes (Figueiredo, 1989; El-Eman et al., 2023). The polymorphism of jojoba seeds has been associated with interactions between genetic traits and production environments, resulting in the formation of ecotypically distinct populations, particularly due to the fact that jojoba develops in semi-arid, desert, and coastal regions (Al-Ani et al., 1972; Meyer, 2008).
In addition, adequate water supply has been found to favor the development of more oval-shaped seeds and to increase their weight compared to elongated seeds (Ayerza, 1993). Another factor reported is the presence of more than one seed per fruit, where capsules containing two or three seeds tend to present flatter and more elongated shapes (Yermanos and Duncan, 1976; Ayerza, 1982).
Seed image analysis, particularly the evaluation of color, shape, and size variables, has been widely applied in the classification of species diversity (Loddo et al., 2023, Felix et al., 2018). The grayscale intensity values extracted from the radiographic images showed statistical differences among the seeds of the evaluated jojoba lots. The values of integrated density, mean, minimum, maximum, median, and mode of gray levels have been associated with tissue integrity in radiographic image analyses (Medeiros et al., 2020b; Silva et al., 2020; Trujillo et al., 2021). The grayscale intensity observed in radiographic images is determined by the thickness, density, and composition of the seed tissues (Medeiros et al., 2020a, 2020b), in addition to the size and moisture content of the seed (Trujillo et al., 2021). Thus, darker regions in radiographic images reflect lower gray intensity and lower integrated absorbance of X-rays, often associated with tissue loss or the presence of empty areas. On the other hand, seeds with greater tissue filling exhibit lighter regions, with higher gray intensity and integrated density values (Carvalho et al., 2010). These contrast differences are directly related to the attenuation coefficient, which depends on the density, thickness, and chemical composition of the seed tissues (Kotwaliwale et al., 2011).
Multivariate analysis made it possible to explore the variability among the evaluated lots using variables associated with shape, size, and grayscale intensity characteristics. The PCA showed that the first three components explained most of the variance, which led to the separation of lot 5 from the other evaluated lots. Additionally, the dendrogram generated by hierarchical cluster analysis confirmed the distinction of lot 5 from the other lots, reflecting differences in seed production systems or in the environmental conditions in which the seeds were obtained (Meza et al., 2017).
The clustering of cultivars based on the hierarchical analysis of traits allows for the identification of close or distant relationships between the evaluated characteristics, leading to the formation of related or unrelated groups, which are graphically represented by the dendrogram (Cruz et al., 2020).
Studies based on hierarchical cluster analysis in jojoba have demonstrated a wide range of genetic variability among the evaluated materials. They also observed that leaf and canopy size, as well as seed size and shape, significantly contribute to this variability, indicating that these components play a major role in the differentiation among the formed groups (Meza et al., 2017). This high genetic diversity can be explained by the fact that jojoba is a dioecious species with a high rate of cross-pollination, resulting in extensive genetic recombination and potentially impacting seed production uniformity and oil quality (Al-Obaidi et al., 2017a).
Moreover, hierarchical clustering based on morphometric seed properties—such as size, shape, length, width, and axis ratio—has proven useful in the separation of cultivars in carob (Ceratonia siliqua) (Barracosa et al., 2007), Silene spp. (Fawzai et al., 2010), mustard (Brassica spp.) (Geetha et al., 2011), Leucaena leucocephala (Feliz et al., 2024), and Vitis spp. (Martín-Gómez et al., 2024). These results reinforce the usefulness of morphometric approaches based on digital images for the characterization of seed lots and as a tool for monitoring and quality control, assisting in the detection of possible mixtures of plant or inert material.
Seeds with high physiological quality exhibit good germination, uniformity, and vigor, which are essential not only for successful crop establishment but also for achieving high productivity and economic return throughout the production chain. In the present study, the evaluation of the physiological quality of jojoba seeds revealed significant differences in germination among the lots.
Lots 1 and 2 did not germinate after ten days, indicating complete inviability under the tested conditions. This suggests issues with the initial quality of these seeds, which may be related to internal damage, aging, or inadequate storage conditions (Marcos-Filho, 2020). Lot 5, on the other hand, showed superior performance, with 91% germination, while lots 3 and 4 exhibited intermediate germination rates of 64% and 42%, respectively (Fig. 6). This result may be attributed to various factors that affect seed vigor and viability, including environmental conditions during field production, harvesting practices, processing, and storage conditions (Carvalho and Nakagawa, 2012).
Rost et al. (1977), in their study on jojoba seed anatomy, reported the presence of trichomes on the seed coat surface, particularly in regions near the micropyle and chalaza. These trichomes, also observed in Figure 7, may serve functions related to physical protection and regulation of interactions with the external environment, especially under low humidity conditions.
As described by Rost et al. (1977), the seed coat is composed of elongated sclerenchymatic cells (macrosclereids) in the outermost layer, followed by collapsed parenchymal tissues in the inner regions, which were also visualized in the present study (Figs. 7C–7E). The adaptive morphology of the jojoba plant is not limited to its seeds: the root system (Fig. 7A and 7B) can reach depths of up to 9 meters, as described by Gentry (1958). According to Ash et al. (2012), this deep root architecture is one of the factors contributing to the species’ tolerance to arid environments, such as the Sonoran Desert, the native region of jojoba.
The morphometric differences identified in this study among the different lots indicate the interaction between genetic and environmental factors that affect seed viability from formation onward. The relationship between structural characteristics and physiological performance supports the applicability of this approach in monitoring the quality of commercial seed lots. Furthermore, the use of modern, non-destructive, rapid, and effective technologies for seed quality control can contribute to the expansion of jojoba cultivation and the strengthening of its production chain.
Although this study shows that radiographic and morphometric analyses can be very informative for assessing jojoba seed quality, some limitations need to be acknowledged. All images were obtained with a single X-ray system under fixed settings, which restricts direct extrapolation to other devices and laboratories. The work was also conducted with a limited number of lots from a single supplier. There was no external validation with independent material from other crops or companies, no formal seed-based predictive model for germination or vigor, and seedling performance at later stages (such as 30 days) was not measured. Even so, the clear differences between lots, especially the distinct behavior of lot 5, indicate that the method is capable of capturing significant variations in seed condition. A next step in future work is to define practical cutoff values, for example, based on ash level intensity, to support real-time lot screening and then test these criteria prospectively in different years, environments, and suppliers, following the principles used to establish decision limits in seed quality control and processing workflows (Tausch, 2024). This would help consolidate the use of fast, non-destructive imaging as a routine tool in quality control, conservation, and propagation of jojoba seeds.
5 Conclusions
X-ray imaging and digital image processing are effective tools for evaluating the quality and providing a detailed characterization of the internal structure of jojoba seeds. Scanning electron microscopy complemented the radiographic analysis by providing a morphological basis for the internal attributes visualized.
The information obtained from the images made it possible to infer the morphometric characteristics of the seeds, allowing for the characterization of jojoba seed lots. Lot 5, in particular, stood out by presenting the largest area, perimeter, and width, as well as the highest grayscale intensity values, reflecting brighter regions in the radiographic images associated with greater tissue presence and integrity, and the highest germination rate (91%).
Principal component analysis (PCA) and hierarchical clustering (dendrogram) supported the distinction of Lot 5 from the other lots, suggesting that the attributes of grayscale intensity (mean, median, mode, and integrated density of gray values) and size (area), which were the most important in PC1, are strongly associated with its superior quality.
Radiography and digital image analysis show strong potential as auxiliary tools for the rapid and non-destructive evaluation of the internal and external quality of jojoba seed lots, allowing the distinction of lots with greater vigor and physical purity for commercial and conservation purposes.
Acknowledgments
The authors thank JOJOBA DO BRASIL LTDA, Finep, FAPEMIG, CNPq, and CAPES for funding the scholarship - Funding Code 001. The Central Laboratory for Seed Research, and the Laboratory of Electron Microscopy and Ultrastructural Analysis of the Federal University of Lavras (UFLA) for providing the seeds used in this research, as well as for financial support, equipment, and technical assistance for experiments involving physiological evaluations and electron microscopy. ID B-P is currently pursuing a doctorate, supported by a scholarship awarded by CAPES, process code: 88887.894017/202300 (CAPES: PROEX).
Conflicts of interest
The authors declare no competing interests. Jojoba Brasil Negócios Ltda contributed exclusively by supplying the seed material used in the experiments. The company did not provide financial support, had no role in the experimental design, data collection, image acquisition, data analysis, statistical treatment, interpretation of results, or manuscript preparation. Data analysis was performed using objective, quantitative criteria, and no results were shared with the company prior to submission. To ensure objectivity, the experimental workflow and analyses were pre-specified, and the interpretation of results was based solely on the observed data. No influence from the seed supplier occurred at any stage of the study.
Data availability statement
The extracted feature tables, as well as the scripts used for statistical analysis (R), are publicly available in the following repository: https://github.com/IvanBripin/Jojoba-seed-research.git
The original radiographic images, due to their large size and association with specific experimental material, have not been made publicly available, but can be provided upon reasonable request to the corresponding author.
Author contribution statement
Conceptualization: I.D Briceño-Pinzon, R.G. Mariniano de Pádua, R.M Oliveira Pires, G.R Gontijo, P. Dias, J.A. de Magalhães, H.B Gusmão Martins. Data Curation: I.D Briceño-Pinzon, R.G. Mariniano de Pádua, R.M Oliveira Pires, G.R Gontijo. Formal Analysis: I.D Briceño-Pinzon, R.M Oliveira Pires, G.R Gontijo. Funding Acquisition: R.M Oliveira Pires, H. Oliveira dos Santos. Supervision: R.M Oliveira Pires, H. Oliveira dos Santos. Project Administration: R.M Oliveira Pires. Resources: R.M Oliveira Pires, H. Oliveira dos Santos, P. Dias, J.A. de Magalhães, H.B Gusmão Martins. Investigation: I.D Briceño-Pinzon, R.G. Mariniano de Pádua, G.R Gontijo, Y.M Barros Dias. Visualization: I.D Briceño-Pinzon, R.M Oliveira Pires, G.R Gontijo Writing - original draft: I.D Briceño-Pinzon, R.G. Mariniano de Pádua, R.M Oliveira Pires, G.R Gontijo. Review & editing: I.D Briceño-Pinzon, R.G. Mariniano de Pádua, R.M Oliveira Pires, G.R Gontijo, Y.M Barros Dias, P. Dias, J.A. de Magalhães, H.B Gusmão Martins, H. Oliveira dos Santos.
Supplementary Material
Supplementary materials, including Figures S1–S5 and Tables S1–S3, are provided in the Supplementary Information file.
Fig. S1. Histogram plots for radiographic images of jojoba seeds, lot 1. The red line indicates the threshold determined by the Auto Threshold command in ImageJ software. Each image was composed of 25 seeds.
Fig. S2. Histogram plots for radiographic images of jojoba seeds, lot 2. The red line indicates the threshold determined by the Auto Threshold command in ImageJ software. Each image was composed of 25 seeds.
Fig. S3. Histogram plots for radiographic images of jojoba seeds, lot 3. The red line indicates the threshold determined by the Auto Threshold command in ImageJ software. Each image was composed of 25 seeds.
Fig. S4. Histogram plots for radiographic images of jojoba seeds, lot 4. The red line indicates the threshold determined by the Auto Threshold command in ImageJ software. Each image was composed of 25 seeds.
Fig. S5. Histogram plots for radiographic images of jojoba seeds, lot 5. The red line indicates the threshold determined by the Auto Threshold command in ImageJ software. Each image was composed of 25 seeds.
Table S1. p-value for the Shapiro-Wilk and Bartlett tests for the features extracted from the radiographic images.
Table S2. Multiple comparisons between jojoba seed lots using Tukey's HSD test (adjusted p) and effect sizes (Hedges' g) with 95% confidence intervals.
Table S3. Silhouette width values for seed lots obtained from hierarchical cluster analysis based on standardized Euclidean distance and the UPGMA method.
Access Supplementary MaterialReferences
- Abdel-Mageed WM, Bayoumi SA, Salama AA, Salem-Bekhit MM, Abd-Alrahman SH, Sayed HM. 2014. Antioxidant lipoxygenase inhibitors from the leaf extracts of Simmondsia chinensis. Asian Pac J Trop Med 7S1: S521–S526. https://doi.org/10.1016/S1995-7645(14)60284-4. [Google Scholar]
- Abobatta WF, Sun X, Mohamed NA. Jojoba Cultivation: A tool for developing marginal lands. In: Hussain WS and Abobatta WF, eds. Achieving Food Security Through Sustainable Agriculture. IGI Global Scientific Publishing, 2024, pp. 229–251. [Google Scholar]
- Al-Ani AH, Strain BR, Mooney HA. 1972. The physiological ecology of diverse populations of the desert shrub Simmondsia chinensis. J Ecol 60: 41–57. https://doi.org/10.2307/2258039. [Google Scholar]
- Alcaraz L, Zamudio D, Cosío SM, Rodríguez M, Meza R, Orduño A. Diagnóstico de la Jojoba (Simmondsia chinensis) (Link)C. K. Schneider, en México. Chapingo: Universidad Autónoma Chapingo. [Google Scholar]
- Al-Obaidi JR. Contribution of Jojoba (Simmondsia chinensis) products in human health. In: Ozturk M, Hakeem K, eds. Plant and Human Health, Volume 2. Cham (Germany): Springer, 2019, pp. 303–312. https://doi.org/10.1007/978-3-030-03344-6_12. [Google Scholar]
- Al-Obaidi JR, Halabi MF, AlKhalifah NS, Asanar S, Al-Soqeer A, Attia MF. 2017a. A review on plant importance, biotechnological aspects, and cultivation challenges of jojoba plant. Biol Res 50: 25. https://doi.org/10.1186/s40659-017-0131-x. [Google Scholar]
- Al-Obaidi JR, Rahmad N, Hanafi NM, Halabi MF, Al-Soqeer A. 2017b. Comparative proteomic analysis of male and female plants in Jojoba (Simmondsia chinensis) leaves revealed changes in proteins involved in photosynthesis, metabolism, energy, and biotic and abiotic stresses. Acta Physiol Plant 39: 179. https://doi.org/10.1007/s11738-017-2485-7. [Google Scholar]
- Ameen M, Zafar M, Ahmad M, et al. 2023. Assessing the bioenergy potential of novel non-edible biomass resources via ultrastructural analysis of seed sculpturing using microscopic imaging visualization. Agronomy 13: 735–751. https://doi.org/10.3390/agronomy13030735. [CrossRef] [Google Scholar]
- Ash GJ, Albiston A, Cother EJ. 2005 Aspects of jojoba agronomy and management. Adv Agron 85: 409–437. https://doi.org/10.1016/S0065-2113(04)85007-7. [Google Scholar]
- Ayerza R (H). 1982. Considerações técnicas para o desenvolvimento do cultivo da jojoba (Simmondsia chinensis Link.). I Ciclo de palestras sobre jojoba. Natal (Brasil): Empresa de Pesquisa Agropecuária do Rio Grande do Norte. [Google Scholar]
- Ayerza R (H). 1993. Effect of irrigation on jojoba production under arid chaco conditions: II-Seed yields and wax quality. J Am Oil Chem Soc 70: 1225–1228. https://doi.org/10.1007/BF02564230. [Google Scholar]
- Ayerza R (H). 2020. Variabilidad en el contenido de aceite en la jojoba de Argentina. Rev Mex Cien Agríc 11: 841–852. https://doi.org/10.29312/remexca.v11i4.2074. [Google Scholar]
- Azpeitia LG, Labrada-Delgado GJ, Montalvo-González E, Loza-Cornejo S. 2022. Morphometric and anatomical characters of fruits and seeds of a population of Prosopis laevigata (Fabaceae) in Lagos de Moreno, Jalisco, Mexico. Acta Bot Mex 129: e2057. https://doi.org/10.21829/abm129.2022.2057. [Google Scholar]
- Bakr ESO, Shetaewi MMA, Amer WA, Abdelsamie AM, Ibrahim IMM. 2025. Influence of biologically treated jojoba meal with or without Alpinia galanga on growth performance and blood profile of weanling rabbits in North Sinai. Egypt J Adv Vet Res 15: 178–184. [Google Scholar]
- Bala R. 2020. In vitro seed germination behaviour of Simmondsia chinensis. Modern Res Bot 1: 158–163. [Google Scholar]
- Balkaya A, Odabas MS. 2002. Determination of the seed characteristics in some significant snap bean varieties grown in Samsun, Turkey. Pak J Biol Sci 5: 382–387. https://doi.org/10.3923/pjbs.2002.382.387. [Google Scholar]
- Barracosa P, Osório J, Cravador A. 2007. Evaluation of fruit and seed diversity and characterization of carob (Ceratonia siliqua L.) cultivars in Algarve region. Sci Hortic 114: 250–257. https://doi.org/10.1016/j.scienta.2007.06.024. [Google Scholar]
- Bianchini VJM, Mascarin GM, Silva LCAS, et al. 2021. Multispectral and X-ray images for characterization of Jatropha curcas L. seed quality. Plant Methods 17: 1–13. https://doi.org/10.1186/s13007-021-00709-6. [Google Scholar]
- Brasil, Regras para Análise de Sementes (RAS). WikiSDA: Laboratórios – Metodologia – Sementes. Ministério da Agricultura e Pecuária - MAPA, Brasília, 2025. Available from: https://wikisda.agricultura.gov.br/pt-br/Laboratórios/Metodologia/Sementes/RAS_2024 [Google Scholar]
- Carvalho MLM, Alves RA, Oliveira LM. 2010. Radiographic analysis in castor bean seeds (Ricinus communis L.). Rev Bras Sementes 32: 170–175. https://doi.org/10.1590/s0101-31222010000100019. [Google Scholar]
- Carvalho NM, Nakagawa J. 2012. Sementes: - Ciência, Tecnologia e Produção. 5th ed. Jaboticaba: Funep. [Google Scholar]
- Castellanos AE, Molina FE. 1990 Differential survivorship and establishment in Simmondsia Chinensis (jojoba). J Arid Environ 19: 65–76. https://doi.org/10.1016/S0140-1963(18)30830-9. [Google Scholar]
- Castro EM, Pinho ÉVDeRV, Lima AE, et al. 2024. Physiological quality, lignin and the ultrastructural characterization of soybean seeds. Acta Sci Agron 46: e63621. https://doi.org/10.4025/actasciagron.v46i1.63621. [Google Scholar]
- Cervantes E, Martín JJ, Saadaoui E. 2016. Updated methods for seed shape analysis. Scientifica 2016: 5691825. https://doi.org/10.1155/2016/5691825. [Google Scholar]
- Cruz CD, Ferreira F, Pessoni LA. 2020. Biometria aplicada ao estudo da diversidade genética, 2nd ed. Viçosa: Universidade Federal de Viçosa. [Google Scholar]
- Duc NT, Ramlal A, Rajendran A, et al. 2023. Image-based phenotyping of seed architectural traits and prediction of seed weight using machine learning models in soybean. Front Plant Sci 14: 1–15. https://doi.org/10.3389/fpls.2023.1206357. [Google Scholar]
- El-Emam MA, Zhou L, Shi WD, Sobhi M. 2023. Determination of some engineering properties of Jojoba granular matter [Simmondsia chinensis]. Granul Matter 25: 1–13. https://doi.org/10.1007/s10035-023-01313- 2. [Google Scholar]
- El-Seesy AI, He Z, Hassan H, Balasubramanian D. 2020. Improvement of combustion and emission characteristics of a diesel engine working with Diesel/jojoba oil blends and butanol additive. Fuel 279: 118433. https://doi.org/10.1016/j.fuel.2020.118433. [Google Scholar]
- Fawzai N, Fawzy A, Mohamend AAH. 2010. Seed morphological studies on some species of Siline L. (Caryophyllaceae). Int J Bot 6: 287–292. https://doi.org/10.3923/ijb.2010.287.292. [Google Scholar]
- Felix FC, Luiza M, Castro DL, Mattos W, Teixeira A. 2018. Biometria de sementes de espécies florestais da Caatinga por meio da análise de imagens. Informativo ABRATES 28: 46–50. [Google Scholar]
- Felix FC, Das Chagas KPT, Araújo FS, et al. 2024. Image analysis of seeds and machine learning as a tool for distinguishing populations: applied to an invasive tree species. Acta Scientiarum - Agronomy 46: 1–11. https://dor.org/10.4025/actasciagron.v46i1.62658. [Google Scholar]
- Ferreira T, Rasband W. 2012. ImageJ User Guide-IJ1.46r. Bethesda. [Google Scholar]
- Figueiredo S. 1989. Germinação de sementes de jojoba (Simmondsia chinensis (link) Schneider). Rev Bras Fisiol Veg 1: 99–107. [Google Scholar]
- Gad HA, Roberts A, Hamzi SH, et al. 2021. Jojoba Oil: An updated comprehensive review on chemistry, pharmaceutical uses, and toxicity. Polymers 13: 1711. https://doi.org/10.3390/polym13111711. [Google Scholar]
- Geetha V, Balamurungan P, Bhaskaran M. 2011. Characterization of mustard genotypes through image analysis. Res J Seed Sci 4: 192–198. https://doi.org/10.3923/rjss.2011.192.198. [Google Scholar]
- Gentry HS. 1958. The natural history of Jojoba (Simmondsia chinensis) and its cultural aspects. Econ Bot 12: 261–295. https://doi.org/10.1007/BF02860078. [Google Scholar]
- Hair JF, Black WC, Babin BJ, Anderson RE. 2019. Multivariate data analysis. Eighth Edi. Andonver: Cengage Learning. [Google Scholar]
- Hamerlynck EP, Huxman TE. 2009. Ecophysiology of two Sonoran Desert evergreen shrubs during extreme drought. J Arid Enviro 73: 582–585. https://doi.org/10.1016/j.jaridenv.2008.11.012. [Google Scholar]
- IMARC GROUP, Global Jojoba Oil Market to Reach 22,000 Tons by 2028. [Internet], Available from: http://www.imarcgroup.com/global-jojoa-oil-market [Google Scholar]
- Ismail AMA. 1988. The ecological and agronomic role of seed polymorphism in Simmondsia chinensis. J Arid Environ 14: 35–42. https://doi.org/10.1016/s0140-1963(18)31094-2. [Google Scholar]
- Khairi MMA. Genetics and Breeding of Jojoba [Simmondsia chinensis (Link) Schneider]. In: Al-Khayri J, Jain S and Johnson D, eds. Advances in Plant Breeding Strategies: Industrial and Food Crops. Cham (Switzerland): Springer, 2019, pp. 237–276. https://doi.org/10.1007/978-3-030-23265-8_8. [Google Scholar]
- Khairy T, Amin DH, Salama HM, et al. 2025. Pioneering study of Egyptian Neem and Jojoba extracts with molecular docking combat hospital multidrug resistant bacteria. Braz J Microbiol 56: 425–445. https://doi.org/10.1007/s42770-024-01590-w. [Google Scholar]
- Köhler E. Simmondsiaceae, in Flowering Plants Dicotyledons. In: Kubitzki K, Bayer C, eds. The Families and Genera of Vascular Plants. Heidelberg (Germany): Springer, Berlin, 2003, pp. 355–358. https://doi.org/10.1007/978-3-662-07255-4_40. [Google Scholar]
- Kotwaliwale N, Singh K, Kalne A, Jha SN, Seth N, Kar A. 2011. X-ray imaging methods for internal quality evaluation of agricultural produce. J Food Sci Technol 51: 1–15. https://doi.org/10.1007/s13197-011-0485-y. [Google Scholar]
- Lei Q, Li T. 2015. Functional monoesters of jojoba oil can be produced by enzymatic interesterification: reaction analysis and structural characterization. Eur J Lipid Sci Technol 117: 630–636. https://doi.org/10.1002/ejlt.201400458. [Google Scholar]
- Li J, Jaganathan G, Han X, Liu B. 2024. Ultrastructural and thermal analyses reveal novel insights into low-temperature survival mechanisms of hydrated seeds of Poaceae species from alpine regions. Plant Divers 47: 643–652. https://doi.org/10.1016/j.pld.2024.09.010. [Google Scholar]
- Loddo A, Di Ruberto C, Vale AMPG, Ucchesu M, Soares JM, Bacchetta G. 2023. An effective and friendly tool for seed image analysis. Vis Comput 39: 335–352. https://doi.org/10.1007/s00371-021-02333-w. [Google Scholar]
- Marcos-Filho J. Teste de Vigor: Importância e Utilização. In: Krzyzanowski FC, Vieira RD, França-Neto JB, Marcos-Filho J, eds. Vigor de Sementes: Conceitos e Testes. Londrina (Brazil), Associação Brasileira de Tecnologia de Sementes – ABRATES, 2020, pp. 17–77. [Google Scholar]
- Martín-Gómez JJ, Rodríguez-Lorenzo JL, Gutiérrez del Pozo D, et al. 2024. Seed morphological analysis in species of Vitis and relatives. Horticulturae 10: 285–303. https://doi.org/10.3390/horticulturae10030285. [Google Scholar]
- Medeiros AD, Pinheiro DT, Xavier WA, Silva LJ, Dias DCFS. 2020a. Quality classification of Jatropha curcas seeds using radiographic images and machine learning. Ind Crops Prod 146: 112162. https://doi.org/10.1016/j.indcrop.2020.112162. [Google Scholar]
- Medeiros A, Silva LJ, Silva JM, Dias DS, Pereira MD. 2020b. IJCropSeed: An open-access tool for high-throughput analysis of crop seed radiographs. Comput Electron Agr 175: 105555. https://doi.org/10.1016/j.compag.2020.105555. [Google Scholar]
- Meyer SE. Simmondsia chinensis (Link) Schneid. Jojoba. In: Bonner FT, Karrfalt RP, eds. The Woody Plant Seed Manual. Agriculture handbook. Washington DC (U.S): Department of Agriculture - Forest Service, 2008, pp. 1049–1051. [Google Scholar]
- Meza R, Núñez CA, Cabada CA. 2017. Caracterización morfológica de Simmondsia chinensis (Link). C.K. Schneid. en condiciones de riego. Rev Mex Cienc Forestales 8: 77–99. https://doi.org/10.29298/rmcf.v8i42.20. [Google Scholar]
- Mohamed SA, Farouk A, Abdel-Razek AG, Nashy E, El-Sakhawy M, Badr AN. 2025. Carboxymethyl cellulose/shellac composite loaded with pomegranate extract and jojoba oil as anti-mycotic and anti-mycotoxigenic food packaging materials. Sci Rep 15: 955. https://doi.org/10.1038/s41598-024-81933-7. [Google Scholar]
- Mohammady EY, Soaudy MR, Elashry MA, Hassaan MS. 2025. Assessment of the nutritional impact of substituting fishmeal with enzymatically hydrolyzed jojoba meal (Simmondsia chinensis) in the diets of Nile tilapia, Oreochromis niloticus. Aquaculture 596: 741888. https://doi.org/10.1016/j.aquaculture.2024.741888. [Google Scholar]
- Nashy E-SHA, Abo-ELwafa GA, Aly SM, Masoued RA, Elsayed H. 2024. Non-ionic fatliquoring and lubricating agents based on ethoxylated jojoba fatty acids. Waste Biomass Valor 15: 637–648. https://doi.org/10.1007/s12649-023-02227-z. [Google Scholar]
- Nogueira AC, Medeiros ACS. 2007. Extração e Beneficiamento de Sementes Florestais Nativas: Circular Técnica. Colombo: Embrapa Florestal. [Google Scholar]
- Nogueira FPN, Oliveira AB, Pereira M, Fátima QL, Silva RT. 2017. Effectivity of X-ray test to evaluate the physiological quality of sesame seeds due to fruits position at the plant. Rev Bras Ciênc Agrár 12: 435–440. https://doi.org/10.5039/agraria.v12i4a5474. [Google Scholar]
- Otsu N. 1979. A threshold selection method from gray-level histograms. IEEE Trans Syst Man Cybern 9: 62–66. https://doi.org/10.1109/TSMC.1979.4310076. [CrossRef] [Google Scholar]
- R Core Team. 2021. R: A language and environment for statistical computing. Vienna, Austria: R Foundation for Statistical Computing. [Google Scholar]
- Ribeiro AS, Neri TF, Medeiros AD, Milagres CC, Silva L. 2021. Use of radiographic images for rapid and non-destructive assessment of crambe seed quality. J Seed Sci 43: e202143001. https://doi.org/10.1590/2317-1545v43239136. [Google Scholar]
- Rost TL, White JC, Wilson GG, Keeley PE. 1977. Anatomy of Jojoba (Simmondsia chinensis) seed and the utilization of liquid wax during germination. Econ Bot 31: 140–147. https://doi.org/10.1007/BF02866583. [Google Scholar]
- Saadaoui E, Martín JJ, Bouazizi R, et al. 2015. Phenotypic variability and seed yield of Jatropha curcas L. Introduced to Tunisia. Act Bot Mex 110: 119–134. https://doi.org/10.21829/abm110.2015.193. [Google Scholar]
- Sadek S, El-Batran E. 2020. Economic study for the production of Jojoba in Egypt. Alex J Agri Sci 65: 39–52. [Google Scholar]
- Sánchez JA, Pernús M, Barrios D. Gutiérrez A. 2024. Protocolo para germinar y conservar semillas de plantas nativas cubanas: un enfoque con rasgos funcionales de semillas. Acta Bot Cub 223. [Google Scholar]
- Schneider CA, Rasband WS, &Eliceiri KW. 2012. NIH Image to ImageJ: 25 years of image analysis. Nat Methods 9: 671–675. https://doi.org/10.1038/nmeth.2089. [CrossRef] [PubMed] [Google Scholar]
- Silva JÁ, Medeiros AD, Pereira MD, Ramos AKF, Silva LJ. 2020. Seed quality analysis of Senna siamea Lam. using image analysis techniques. J Seed Sci 42: 1–10. https://doi.org/10.1590/2317-1545v42241633. [Google Scholar]
- Sokal R, Rohlf J. 1962. The comparison of dendrograms by objetive methods. Taxon 11: 33–40. https://doi.org/10.2307/1217208. [Google Scholar]
- Soroka AI, Totsky IV, Lyakh VA. 2017. Inheritance of rounded seed shape in sunflower. Helia 40: 189–196. https://doi.org/10.1515/helia-2017-0020. [Google Scholar]
- Tausch S, Leipold M, Reisch C, Poschold P. 2024. How precisely can x-ray predict the viability of wild flower plant seeds? Seed Sci Technol 52: 109–123. https://doi.org/10.15258/sst.2024.52.1.10. [Google Scholar]
- Trujillo HA, Gomes-Junior FG, Mendoza NR, Trujillo CH. 2021. Gray scale of radiographic images in the assessment of degree moisture in soybean seeds. Acta Agron 70: 304–310. https://doi.org/10.15446/acag.v70n3.88319. [Google Scholar]
- Uppar R, Dinesha P, Kumar S. 2024. Yield optimization of nonedible vegetable oil-based bio-lubricant using design of experiments. Environ Dev Sustain 26: 29557–29582. https://doi.org/10.1007/s10668-024-04529-1. [Google Scholar]
- Yermanos DM, Duncan C. 1976. Jojoba seed: Phenotypic within plant variability in wax content and composition. J Am Oil Chem Soc 53: 700–703. https://doi.org/10.1007/BF02586342. [Google Scholar]
Cite this article as: Briceño-Pinzón I.D, Gomes Martiniano de Pádua R, Ribeiro Gontijo G, de Moraes Barros Dias Y, Dias P, de Magalhães J.A, Gusmão Martins H, Oliveira dos Santos H, de Oliveira Pires R.M. 2026. Characterization of Simmondsia chinensis seeds: radiographic, digital morphometric, and ultrastructural analyses. OCL 33: 11. https://doi.org/10.1051/ocl/2026003
All Tables
Mean values ± standard deviation for size, shape, and grayscale intensity characteristics extracted from radiographic images of five jojoba seed lots.
All Figures
|
Fig. 1 Processing of radiographic images of jojoba seeds. A) RGB image in.tiff format; B) 8-bit grayscale image; C) Otsu thresholded image and histogram; D) extraction of morphometric characteristics. Circ: circularity, AR: aspect ratio, Sold: solidity. |
| In the text | |
|
Fig. 2 Radiographic images of jojoba seeds. A) Healthy seed with identification of the basic structures that make up the seed, a 3D representation of the gray levels of each pixel, and a normal seedling. Seeds with internal alterations and abnormal seedlings: B) broken seed; C) fruit with two malformed seeds; D) infested seed; E) deteriorated seed. F) spherical, elliptical, and elongated seed shapes. |
| In the text | |
|
Fig. 3 Box plot of height and width distribution in millimeters for jojoba seeds from each evaluated lot. Each box indicates the range between quartiles, the inner line represents the median, and the outer limits correspond to the minimum and maxim um values. The individual points in each box plot represent the outliers. The colors differentiate the two variables analyzed: width (green) and height (blue). |
| In the text | |
|
Fig. 4 A) Scree plot of the eigenvalues for each extracted component, the red dashed line represents the Kaiser criterion (eigenvalue >1). B) Scree plot of the percentages of variance explained for the first 10 principal components. C) Principal Component Analysis obtained for morphometric data from jojoba seeds (n = 500), showing the distribution of the five lots evaluated. Each point represents an individual seed, colored according to the original lot, and the ellipses indicate the dispersion of the data with a 95% confidence interval for each lot. |
| In the text | |
|
Fig. 5 Dendrogram for the classification of five jojoba seed lots based on the UPGMA method. The red dashed line indicates the cutting level defined by Mojena’s rule. The cophenetic correlation coefficient was 0.88. |
| In the text | |
|
Fig. 6 Germination percentage for different lots of jojoba seeds. L3: Lot three, L4: Lot four, L5: Lot five. Different lowercase letters in the bar chart indicate significant differences according to Tukey’s test at the 5% level. Error bars represent the standard error. |
| In the text | |
|
Fig. 7 Scanning electron micrograph. A and B) radicle tip; C and D) inner surface of the seed coat; E) outer surface of the seed coat and presence of trichomes; F) cotyledon. |
| In the text | |
Current usage metrics show cumulative count of Article Views (full-text article views including HTML views, PDF and ePub downloads, according to the available data) and Abstracts Views on Vision4Press platform.
Data correspond to usage on the plateform after 2015. The current usage metrics is available 48-96 hours after online publication and is updated daily on week days.
Initial download of the metrics may take a while.