")
")
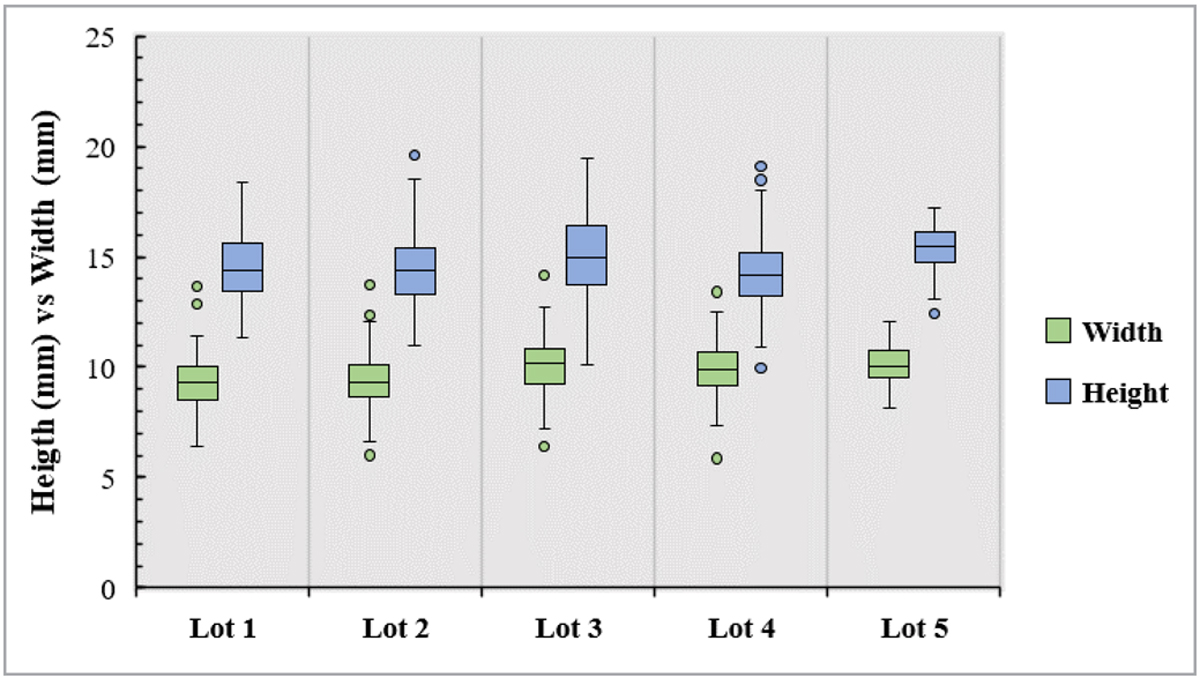
Fig. 3
Download original image
Box plot of height and width distribution in millimeters for jojoba seeds from each evaluated lot. Each box indicates the range between quartiles, the inner line represents the median, and the outer limits correspond to the minimum and maxim um values. The individual points in each box plot represent the outliers. The colors differentiate the two variables analyzed: width (green) and height (blue).
Current usage metrics show cumulative count of Article Views (full-text article views including HTML views, PDF and ePub downloads, according to the available data) and Abstracts Views on Vision4Press platform.
Data correspond to usage on the plateform after 2015. The current usage metrics is available 48-96 hours after online publication and is updated daily on week days.
Initial download of the metrics may take a while.