")
")
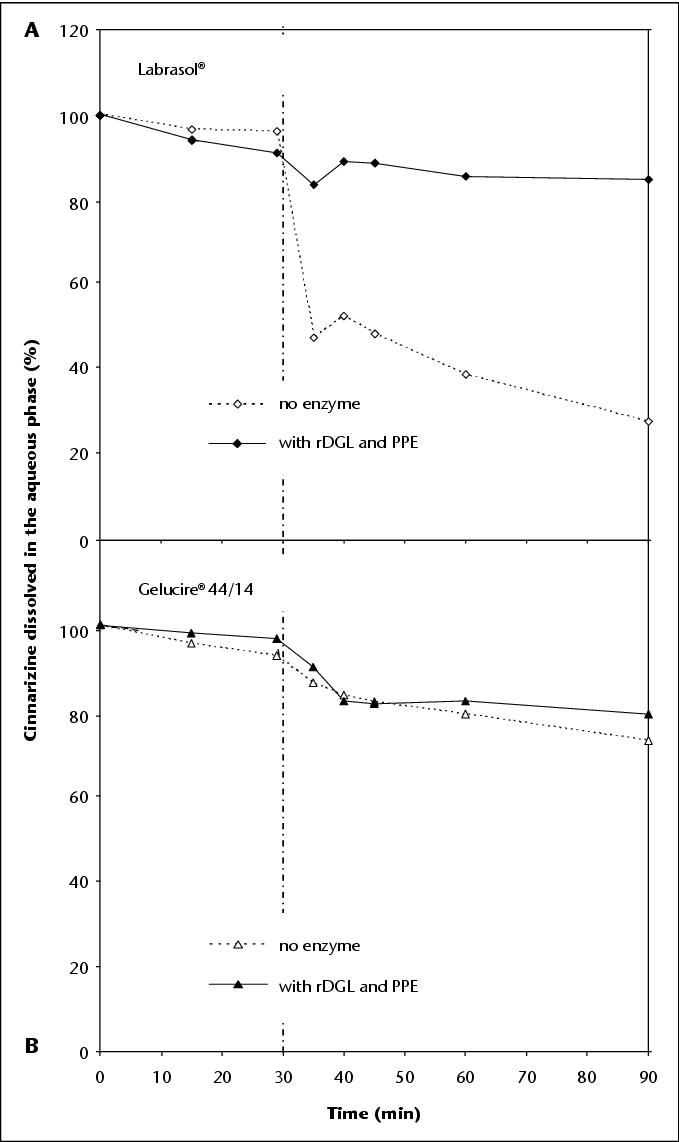
Figure 2.

Download original image
Evolution of the concentration of cinnarizine dissolved in the aqueous phase, expressed in percent of the initial dose, during the gastrointestinal lipolysis by rDGL and PPE of Labrasol® (A) and Gelucire® 44/14 (B) as a function of time. The vertical line at 30 min represents the end of gastric lipolysis step and the beginning of duodenal lipolysis step. Adapted from (Fernandez et al., 2009).
Current usage metrics show cumulative count of Article Views (full-text article views including HTML views, PDF and ePub downloads, according to the available data) and Abstracts Views on Vision4Press platform.
Data correspond to usage on the plateform after 2015. The current usage metrics is available 48-96 hours after online publication and is updated daily on week days.
Initial download of the metrics may take a while.