")
")
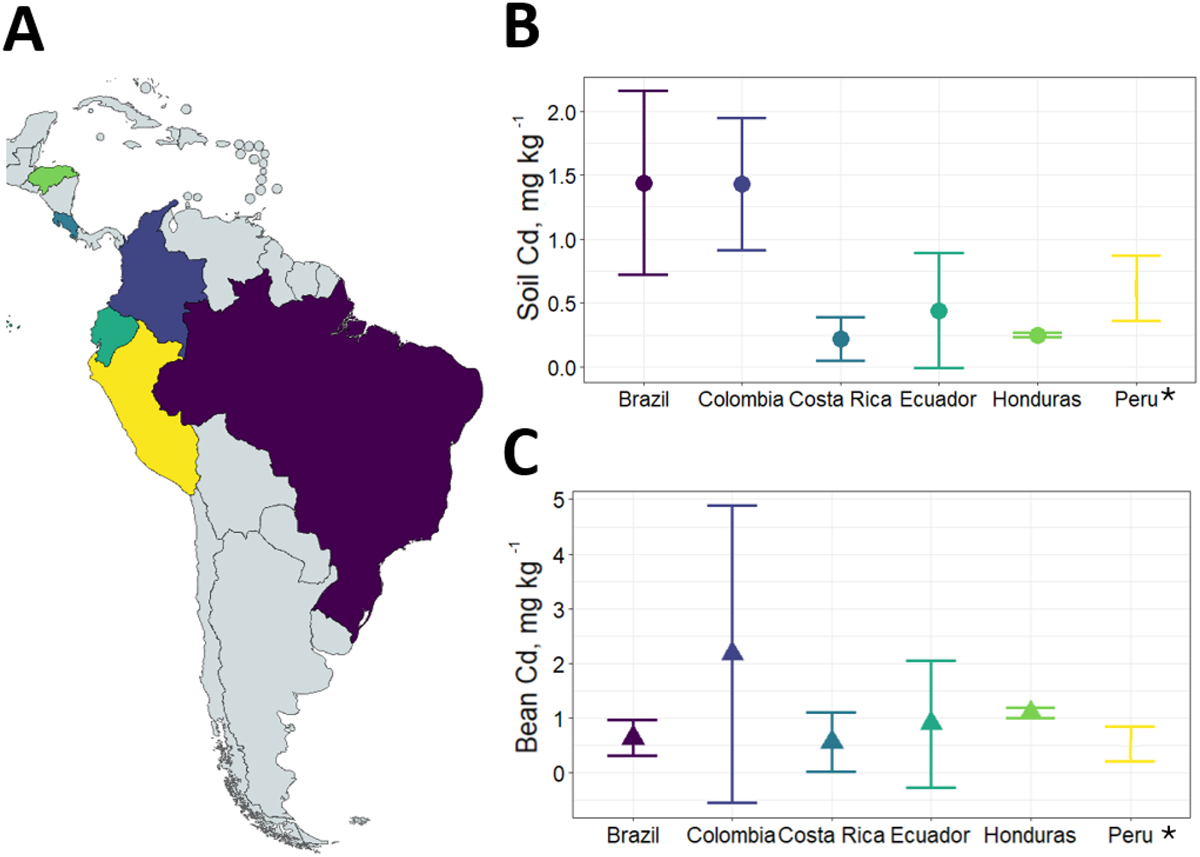
Fig. 2
Download original image
A. Map showing countries with Cd national surveys in Latin America B. Soil Cd for each country (Mean and SD, except for Peru: min and max Cd concentration). C. Bean Cd for each country (Mean and SD, except for Peru: min and max Cd concentration). Data for Brazil do not come from a Nation-scale study, but they were included for comparison.
Current usage metrics show cumulative count of Article Views (full-text article views including HTML views, PDF and ePub downloads, according to the available data) and Abstracts Views on Vision4Press platform.
Data correspond to usage on the plateform after 2015. The current usage metrics is available 48-96 hours after online publication and is updated daily on week days.
Initial download of the metrics may take a while.