")
")
| Issue |
OCL
Volume 32, 2025
How oil- and protein- crops can help fight against climate change? / Contribution des oléoprotéagineux à la lutte contre le changement climatique
|
|
|---|---|---|
| Article Number | 1 | |
| Number of page(s) | 12 | |
| DOI | https://doi.org/10.1051/ocl/2024032 | |
| Published online | 03 January 2025 | |
Research Article
Use of suspensions of phytosterol microparticles to improve the solubility of methane in water☆
1
Laboratoire de Chimie Agro-industrielle, LCA, Toulouse INP, INRAE, Université de Toulouse, Toulouse, France
2
Toulouse Biotechnology Institute, TBI, INSA, Université de Toulouse, Toulouse, France
3
Dina BioRes# Chem, 10 rue Simone Henry, 31 200 Toulouse, Toulouse, France
* Corresponding author: This email address is being protected from spambots. You need JavaScript enabled to view it.
Received:
23
July
2024
Accepted:
27
November
2024
Abstract
Methane, an abundantly produced greenhouse gas, is a major driver of global climate change. The development of sustainable processes for methane capture is limited by the poor solubility of this organic compound in water, but this solubility can be increased by adding other compounds to the aqueous solution. Here, we studied the solubility of methane in aqueous dispersions containing lipid microparticles of phytosterols—a group of sterol compounds from plants—at room temperature and atmospheric pressure. The solubility of the phytosterols in water was improved chemically, by functionalization with glycerol carbonate in solvent-free conditions, and physically, by antisolvent precipitation to form particles in water. We evaluated the influence of phytosterol microparticles on methane solubility in water by monitoring the apparent partition coefficient between the gas and liquid phases defined by Henry’s law. Phytosterol functionalization generated amphiphilic phytosterols with glycerol branches, which were characterized by FTIR and MALDI-TOF. These amphiphilic phytosterols formed particles of 2 and 12 μm in diameter on antisolvent precipitation. Systems containing phytosterol microparticles had a partition coefficient half that of the corresponding control. The gas-liquid equilibrium was, therefore, shifted to the liquid state, demonstrating that the solubility of methane in water was improved by phytosterol microparticles.
Résumé
Utilisation de suspensions de microparticules de phytostérols pour améliorer la solubilité du méthane dans l’eau. Le méthane, un gaz à effet de serre produit en abondance, est un facteur majeur du changement climatique mondial. Le développement de procédés durables de captage du méthane est limité par la faible solubilité de ce composé organique dans l’eau, mais cette solubilité peut être augmentée en ajoutant d’autres composés à la solution aqueuse. Ici, nous avons étudié la solubilité du méthane dans des dispersions aqueuses contenant des microparticules lipidiques de phytostérols − un groupe de composés stérols issus de plantes − à température ambiante et à pression atmosphérique. La solubilité des phytostérols dans l’eau a été améliorée chimiquement, par fonctionnalisation avec du carbonate de glycérol dans des conditions sans solvant, et physiquement, par précipitation pour former des particules dans l’eau. Nous avons évalué l’influence des microparticules de phytostérols sur la solubilité du méthane dans l’eau par détermination de son coefficient de partage apparent entre les phases gazeuse et liquide comme défini par la loi de Henry. La fonctionnalisation des phytostérols a généré des phytostérols amphiphiles, caractérisés par FTIR et MALDI-TOF. Ces phytostérols amphiphiles forment dans l’eau des particules de 2 et 12 μm de diamètre par précipitation dans un anti-solvant. Les systèmes contenant des microparticules de phytostérols présentent un coefficient de partage moitié inférieur à celui du contrôle. L’équilibre gaz-liquide a donc été déplacé vers l’état liquide, démontrant que la solubilité du méthane dans l’eau est améliorée par les microparticules de phytostérols.
Key words: Phytosterols / methane solubility / functionalization / Henry’s constants
Mots clés : Phytostérols / solubilité du méthane / fonctionnalisation / constantes de Henry
Contribution to the Topical Issue: “How oil- and protein- crops can help fight against climate change? / Contribution des oléoprotéagineux à la lutte contre le changement climatique”.
© J. Gallard et al., Published by EDP Sciences, 2025
 This is an Open Access article distributed under the terms of the Creative Commons Attribution License (https://creativecommons.org/licenses/by/4.0), which permits unrestricted use, distribution, and reproduction in any medium, provided the original work is properly cited.
Highlights
Microparticles of phytosterol improve the solubility of methane in aqueous solution.
Amphiphilic phytosterols were synthesized from glycerol carbonate and phytosterols.
Methane showed a better affinity with systems containing amphiphilic phytosterols than native phytosterols.
Pure olive oil had the best capacity for CH4 absorption, with the lowest gas-liquid partition coefficient H.
1 Introduction
Methane (CH4) is a powerful molecule with several applications in energy production, heat production, and as a biofuel (Chen and Weng, 2023; Freakley et al., 2021). However, it is also a major driver of global climate change as one of the most abundantly produced greenhouse gases (GHG), accounting for 30% of current net climate forcing (Alonso et al., 2017). It has a global warming potential 28 times greater than that of carbon dioxide (CO2) over a 100-year reference time frame (Freakley et al., 2021). The technological development of CH4 recovery processes is a major issue in the chemical industry and in biogas production. Research is currently focusing on new processes for minimizing atmospheric CH4 emissions (Lackner, 2020). Current solutions for the physical removal of CH4 include cryogenic separation, molecular sieves and zeolite filters (Boucher and Folberth, 2010), all of which are very costly in terms of energy and technology. However, methane capture methods are limited by the low solubility of methane in water (Sander, 2008). There are two ways of improving this solubility. The first involves reacting methane with other substances to form products that dissolve more readily in water (Horn and Schlögl, 2015). The second involves dissolving methane in solution with a suitable reagent (Avalos Ramirez et al., 2012). Rigorous technical and economic data are also currently lacking for CH4 capture with these methods.
The chemical conversion of methane requires high temperatures and pressures due to its strong C–H bond (434 kJ/mol) (Cai and Hu, 2019). Under catalytic action, methane can be converted into water-soluble chemicals, such as methanol (Hameed et al., 2014), carboxylic acid (Periana et al., 2003), and aromatic hydrocarbons (Tang et al., 2014) under specific reaction conditions. The high energy barrier required for methane activation necessitates the use of extreme reaction conditions—with high temperatures, high pressures, and strong acids—for the conversion of methane into other chemicals (Skutil and Taniewski, 2006).
It is also possible to use methanotrophs—microorganisms that use methane as a carbon source—to transform CH4 into molecules of interest. However, the use of such microorganisms in CH4 capture is limited by the poor solubility of CH4 in aqueous medium. Several studies have reported the use of oily components in the medium to improve yields. For example, the addition of paraffin oil to water has been shown to increase methane solubility 10-fold (Han et al., 2009), with a 1.6 times higher methanol yield from methanotrophs due to the increase in methane availability (Patel et al., 2020).
The identification of a suitable solution that can dissolve methane without transformation reactions is challenging. Several methods have been developed for increasing the solubility of poorly soluble organic compounds such as methane, by adding compounds, such as surfactants, to the medium. Methane solubility decreases with increasing temperature and increases linearly with the concentration of sodium dodecyl sulfate (SDS) above the critical micelle concentration (CMC) or critical aggregation concentration (CAC) of the surfactant (Valentin and Mouloungui, 2013), indicating that the gas molecules are solubilized by the micelles in these solutions (Hai et al., 1999). Standard Gibbs energies for the transfer of methane from bulk solutions to micelles have large negative values, indicating that the hydrophobic gas is present preferentially in the hydrophobic interior of the micelles (Hariz et al., 2017). Micelles of sodium oleate and cyclohexane at a molar ratio of 1/3 form a nanometric system (optimum for micelles of 200–350 nm in diameter) for the solubilization of methane at concentrations of up to 17.1 ml CH4/mL water (Huang et al., 2019). Another study by the same team (Huang et al., 2020) showed that surfactant-alkane systems, such as that based on sodium oleate/hexane, had remarkable solubility properties, superior to those of systems based solely on surfactants.
One study showed that the optimal conditions for methane solubilization in water to which anionic–nonionic surfactants were added at various ratios was variable (Zhou et al., 2018). Based on an analysis of the solubilization effect and the stability of different absorbents, it was concluded that anionic–nonionic surfactant system were more effective for methane solubilization than other selected surfactants. King (1992) measured methane solubility in aqueous solutions of a commercially available polyethoxylated lauryl alcohol, for aqueous solutions containing two different mixtures of BRIJ 35 and BRIJ 30. The intramicellar solubility of methane gas was found to increase with surfactant concentration, for both pure BRIJ 35 and for each of the surfactant mixtures. In terms of methane solubilization, it was concluded that polar polymerized ethylene oxide groups do not contribute to the solubilization of methane and that the solubilizing capacities of the hydrophobic interiors of the micelles composed of BRIJ 35 and its mixtures with BRIJ 30 closely approximate the sorptive capacity of pure lauryl alcohol. The solubility of methane in solutions of monoethanolamine, diethanolamine, and triethanolamine has been measured at temperatures of 25–125°C and pressures of up to about 13 MPa, and methane was found to be soluble (molar fraction) in the amine solution than in pure water. Furthermore, solubility increased with the size of the alkanolamine (Carroll et al., 1998).The use of nanoparticles as sorbent materials for methane capture has also attracted considerable interest. These nanomaterials have a high surface-to-volume ratio for interactions and can be synthesized to have specific physicochemical properties. Several studies have suggested that organic nanomaterials, such as phenol-based activated carbon (Lee et al., 2007), carbon MW-nanotubes preloaded with water (Zhou et al., 2005), or metal organic frameworks (MOF), could be used for CH4 capture (Llewellyn et al., 2008; Saha et al., 2010). It is difficult to compare studies due to differences in the pressures and temperatures used, but the studies cited above suggest that these nanomaterials increase the solubility of methane in water.
We focus here on phytosterols because they are biosourced and biodegradable compounds biologically synthesized from squalene. Squalene has been shown to have a good affinity for methane (Chappelow and Prausnitz, 1974), but to the best of our knowledge, phytosterols affinity with methane has never reported in the literature. Overall, there are no studies demonstrating the increase in the solubility of methane in water under the action of phytosterols and derivatives. Squalene is an hydrophobic molecule able to solubilize other hydrophobic organic compounds. Phytosterols are triterpenes with a hydrophobic skeleton consisting of a four-membered steroid ring with a side chain of 9 or 10 carbon atoms. Their hydrophilic moiety results from the presence of an OH group, providing possibilities for chemical modification of potential value for industrial development (Mouloungui et al., 2006). Phytosterols could be a cheaper alternative to squalene to solubilize methane. Most of the phytosterols currently on the market are obtained as by-products of the production and refining of oils from the seeds of plants such as soybean and rapeseed. Phytosterols are obtained from the recycling of deodorization wastewater (Daguet and Coic, 1999). Like squalene and squalane, phytosterols are insoluble in water and require specific preparation to form stable dispersions in water. They can form nanoparticles stabilized by a surfactant by the antisolvent precipitation method (Rossi et al., 2010).
Structural modifications to phytosterols are primarily designed to increase solubility in oils, but phytosterols also have considerable potential for applications in low-fat and fat-free foods if their water solubility is increased. Physical modifications (mainly micro-encapsulation) can be used to render phytosterols more hydrophilic. Alternatively, chemical modifications in which polar components are added to phytosterols can be used to obtain chemically stable phytosterols that are more soluble in water. There have been far fewer studies of synthetic hydrophilic phytosterol derivatives than of lipophilic phytosterol derivatives (e.g. phytosterol esters, etc.). A recent review (Hu et al., 2022) summarized recent progress in the field of hydrophilic phytosterol derivatives. Most hydrophilic modifications of phytosterols involve the introduction of polar components at the C-3 hydroxyl group. There are two main types of strategy for synthesizing hydrophilic phytosterol derivatives: (1) direct linking of polar components, as in ethoxylated phytosterols (Folmer, 2003), phytosterol glycosides and phytosterol amino acid esters; and (2) coupling with polar components via a spacer, as in phytosterol polyethylene glycol succinate and phytosterol sorbitol adipate. Spacers may be flexible and can change the properties of the entire molecule. Polybasic organic acid and binary anhydride spacers are the most widely used.
In this study, we investigated the influence of phytosterols on CH4 solubility in water in order to use them as new, biosourced and biodegradable additives for CH4 solubilization. Two phytosterol systems were tested: direct dispersion in water with raw mixing (RM), and by antisolvent precipitation (ASP). In both cases, two types of phytosterols were used: native and chemically modified phytosterols. The antisolvent method, as described by Rossi et al. (2010), generated phytosterol microparticles, and chemically modified phytosterols were obtained with glycerol carbonate—a biosourced glycerol derivative —, according to a method based on previously reported protocols (Holmiere et al., 2017;Valentin and Mouloungui, 2013). We also studied the influence of olive oil and epoxidized soy oil on CH4 solubilization as both have been reported to contain 288 mg/100 g and 355 mg/100 g of phytosterols respectively (Yang et al., 2019). We used measurements of Henry’s law constant H to follow the changes in methane solubility in the different aqueous phases using an innovative experimental setup (Benizri et al., 2017). We sought to reduce the value of the H(CH4) constant and to improve selectivity for methane relative to carbon dioxide.
2 Experimental procedures
2.1 Materials
Glycerol carbonate (CAS 931-40-8, Hunstman), ethanol (HPLC grade, CAS 64-17-5, VWR), ethyl acetate (HPLC grade, CAS 141-78-6, VWR), cyclohexane (HPLC grade, CAS 110-82-7, VWR) and ZnSO4.H2O (CAS 7446-19-7, Sigma Aldrich) were purchased and used directly. Phytosterols were obtained from BASF (CAS 949109-75-5, GENEROL 98 RF BASF) and their composition was determined by gas chromatography (β-sitosterol (42.2%), campesterol (33.5%), brassicasterol (8.1%), stigmasterol (0.4%)). Epoxidised soy oil (V-ZICLUS 65 “ESBO”, lot 22BT0504A1, iodine value of 1.6 g(I2)/100 g, and oxirane value of 6.6 g(O2)/100 g) was obtained from Quimidroga (Spain). Commercial olive oil was obtained from Carrefour (Carrefour Extra).
2.2 Synthesis of amphiphilic phytosterols
Amphiphilic phytosterols (PS-amph) were synthesized in a 1 L-batch reactor with mechanical stirring, a refrigerant and a thermometer. The reactor was heated at 220 °C and stirred at 500 rpm. Phytosterols (27 g) and glycerol carbonate (GC, 740 g) were added to the reactor. Once the phytosterols had completely melted, 10 g ZnSO4 was added as a catalyst. The reaction lasted at least 7 h. PS-amph were collected by liquid-liquid extraction with ethyl acetate as the organic solvent, and water as the aqueous solvent to eliminate the ZnSO4, glycerol and glycerol carbonate. Both organic and aqueous phases were treated twice, and the ethyl acetate from the organic phase was evaporated off for collection of the PS-amph in solid form.
2.3 Characterization of amphiphilic phytosterols
PS-amph were analyzed by mass spectrometry in chloroform by matrix-assisted laser desorption ionization (MALDI-TOF). Spectra were recorded in reflection mode on a DSQII (Thermo Fisher Scientific) for analyses in chemical desorption-ionization NH3 mode at Université Paul Sabatier (Toulouse, France). Fourier transform infrared (FTIR) spectra of PS-amph were obtained with a Perkin Elmer Spectrum 65 spectrometer equipped with an attenuated total reflectance (ATR) device (Specac) with a single-reflection diamond crystal.
2.4 Production of phytosterol dispersions
2.4.1 Raw mixing (RM)
Native phytosterols (RM-native) or PS-amph (RM-amph) were dispersed in demineralized water at 16 g/L by vigorous stirring with a Silverson L4RT at 7500 rpm for 3 min.
2.4.2 Antisolvent precipitation (ASP)
Samples ASP-native 1 and ASP-native 5 were prepared at 1 g/L and 5 g/L respectively by the ASP method as described by Rossi et al. (2010). Phytosterols were first dissolved in an organic solvent to form the organic phase. This phase was then mixed with another solvent, miscible with the organic solvent, but in which phytosterols were not soluble, causing precipitation. For ASP-native 1, we dissolved 2 g phytosterol in 200 g absolute ethanol plus 5.78 g Tween 80. After complete solubilization, this organic phase was rapidly added to 1800 g demineralized (ratio org:aq of 1:9V/V) water with vigorous stirring with a Silverson L4RT at 20,000 rpm. For ASP-native 5, 10 g phytosterol were dissolved in 1000 g absolute ethanol plus 28.9 g Tween 80. After complete solubilization, this organic phase was rapidly added to 1000 g demineralized water (ratio org:aq of 1:1V/V) with stirring at 20,000 rpm.
Samples ASP-amph 1, ASP-amph 5 and ASP-amph 15 were prepared according to the following procedure. For dispersions at 1 g/L (ASP-amph 1), 1 g PS-amph was dissolved in 100 g absolute ethanol. After complete solubilization, 40 g of this organic phase was rapidly added to 360 g demineralized water (ratio org:aq of 1:9 V/V) with vigorous stirring with a Silverson L4RT at 7500 rpm. Stirring was continued for another three minutes. For dispersions at 5 g/L (ASP-amph 5) and 15 g/L (ASP-amph 15), 2 g and 6 g PS-amph, respectively, was dissolved in 200 g absolute ethanol. After complete solubilization, the organic phase was rapidly added to 200 g demineralized water (ratio org:aq of 1:1 V/V) with vigorous stirring with a Silverson L4RT at 7500 rpm. Stirring was continued for another 3 min.
Both types of dispersions were analyzed by dynamic light scattering (DLS) with a Malvern MS 3000 to evaluate particle size.
2.5 Measuring Henry constants with a saturometer
2.5.1 Procedure for measuring Henry’s constants
At low pressures, the solubility of gases in liquids is governed by Henry’s law, according to which the saturated solubility of a gas in a liquid is proportional to its partial pressure. The affinity of methane for different solutions was therefore evaluated by calculating the Henry’s law constant H. Lower values of H indicate a greater absorption in the liquid phase. This constant was measured with the “saturometer” experimental setup (Benizri et al., 2017) developed and marketed by EPURTEK (Lacroix-Falgarde, FRANCE). This setup is a batch contactor for gas and liquid in which temperature, pressure and phase concentration are measured continuously or sequentially. The composition of the gas phase (CH4 and CO2) was determined by gas chromatography with a thermal conductivity detector.
The procedure followed was that described in Benizri et al. (2017). Briefly, the tank for the liquid phase was filled with the appropriate liquid (water, or phytosterol dispersions) at atmospheric pressure. The gas tank was then filled with CH4 or CO2 and purged for 3 min. The pressure in the gas cell was initially higher than atmospheric pressure and was adjusted before taking a sample and recording the temperature. The two tanks were separated by a valve, which was closed before the gas injection. This valve was then opened to allow contact between gas and liquid, and the whole system was stirred by rotation of the apparatus until equilibrium was reached. Once the pressure had stabilized, the valve was closed and the temperatures of the gas and liquid were recorded before taking new samples. All measurements occurred at temperatures between 20 and 25 °C. Experiments were performed three times to ensure repeatability.
2.5.2 Analysis of gas composition
Gas samples were analyzed by gas chromatography with a Trace 1300 gas chromatograph equipped with a thermoconductivity detector (TCD). Samples were injected into a PLOT capillary column with a PTFE filter at the injection valve to prevent contamination of the column with liquid and impurities. Helium was used as the carrier gas and the flow rate for the injection was 1 mL/min in split-less mode.
2.5.3 Henry’s constant calculation
The initial and equilibrium molar fractions of the compounds in the liquid and gas phases can be determined from a material balance. The quantity of matter transferred from the gas to the liquid is denoted ni,trans and is calculated as follows (Eq. (1)):
 (1)
(1)
where
yi,in is the molar fraction of compound i in the gas phase in the initial state
yi,eq is the molar fraction of compound i in the gas phase at equilibrium
Ps,in is the pressure of the gas in its initial state
Ps,in is the pressure of the gas at equilibrium
Vgas is the volume of the gas cell
R is the perfect gas constant
Tgas,in is the temperature of the gas in its initial state
Tgas,eq is the temperature of the gas at equilibrium
In this equation, the dissolved gas input is assumed to be negligible relative to the number of moles of water. The pressure and temperature values are recorded by the sensor before and after gas–liquid contact. The gas fraction of compound i is determined by gas chromatography, and the molar fraction in the liquid is defined by the relationship (Eq. (2)):
 (2)
(2)
By Henry’s law, the apparent partition coefficient H of a compound i is calculated as follows (Eq. (3)):
 (3)
(3)
As the apparent Henry’s law constant of a compound decreases, its absorption by the liquid phase increases and it becomes more soluble in the solvent.
For the comparison of liquid phases with different molar masses, apparent partition coefficients are expressed in Pa m3 (absorbent)/mol (compound absorbed).
 (4)
(4)
Measurement uncertainties were quantified on the basis of the uncertainties of the measuring equipment. Uncertainty propagation was calculated as follows (Eq. (5)):
 (5)
(5)
Selectivity, defined as the ratio of the apparent Henry’s law constants of two gases, is used to assess the efficiency of absorption of one gas relative to another. At lower selectivities, the first gas is more efficiently absorbed than the second. In this study, the absorption efficiency for CH4 was compared with that for CO2 (Eq. (6)).
 (6)
(6)
3 Results and discussion
3.1 Functionalization of phytosterols by carbonation chemistry
This pathway involves the synthesis of amphiphilic phytosterols by a ring-opening oligomerization reaction of glycerol carbonate (GC) initiated by the phytosterols. The targeted reaction is the opening of the GC, assisted by the OH function present on phytosterols, as presented in Figure 1. These hypothetical reaction schemes are based on published data for the oligomerization of GC (Mouloungui et al., 2006). The cyclocarbonate group is sensitive to nucleophilic attacks. Aromatic alcohols tend to attack the alkylene carbon, whereas aliphatic alcohols are more likely to attack the carbonyl carbon, in accordance with the HSAB principle (Pearson’s acid-base concept) (Clements, 2003; Yoo et al., 2001). Kinetically, carbonyl attack (Fig. 1, pathway 1) is favored over alkylene attack (Fig. 1, pathway 2). However, this carbonyl attack is reversible and the product obtained is not stable. Conversely, thermodynamically, the cyclic monomer (more stable) is favored over the polymer and the attack on the alkylene carbon atom is irreversible and accompanied by a loss of CO2. The most likely mechanism therefore includes both attack on the alkylene carbon, and attack on the carbonyl carbon (Sonnati et al., 2013).
We synthesized PS-amph in a one-pot reactor with ZnSO4 as the catalyst, resulting in the production of various molecules (Fig. 2).
FTIR analysis of the native phytosterols and the product (PS-amph) showed a qualitative conversion of functional groups. Reaction with GC increased the intensity of the hydroxyl group peak at 3400 cm−1 markedly (Figs. 3A and 3C). This increase indicates an addition of −OH groups from GC to the phytosterol molecule. Surprisingly, the PS-amph spectrum does not contain the linear carbonate peak at 1730 cm−1 predicted on the basis of the theoretical reaction pathway (Fig. 3C and Fig. 2GC). Instead, a strong peak is observed at 1785 cm−1, corresponding to the cyclic carbonate group, with GC eliminated during liquid-liquid extraction. The intensity of this peak can be explained by the formation of coproducts also observed on MALDI-TOF (Fig. 2X and Y). Co-products X and Y, resulting from a transcarbonatation reaction, are problematic as they compete with the intended pathway and inhibit further branching of PS-amph. The rest of the spectrum (700–1400 cm−1) corresponds to phytosterol peaks (1464, 1372 and 1053 cm−1) or GC (1177 and 1082 cm−1).
The two types of phytosterols predominantly present in native phytosterols are campesterol and β-sitosterol, with molar masses of 400 and 414 g/mol respectively (gas chromatography analysis, data not shown). Mass spectrometry of the products formed by the chemical reaction revealed peaks at 400, 414 and 118 g/mol, indicating the presence of unmodified phytosterols and unreacted GC. Peaks between 473 and 828 g/mol were also observed, corresponding to the expected molecules with n and m between 0 and 5. The number of n and m branches can be determined from the molar mass indicated by the peak. We found that the maximum values of n and m were close (5 and 3, respectively), but n was generally greater than m (Fig. 4). Only a few linear carbonates branched, accounting for their characteristic peak being barely visible on FTIR.
 |
Fig. 1 Reaction mechanisms for 5-membered carbonate ring opening (Ochoa-Gómez et al., 2012). |
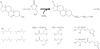 |
Fig. 2 Chemical pathway and expected molecules. |
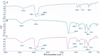 |
Fig. 3 FTIR spectra of (A) native phytosterols, (B) glycerol carbonate, (C) amphiphilic phytosterols synthesized. |
 |
Fig. 4 Degree of polymerization of amphiphilic phytosterols. Number of glycerol [G] and glycerol carbonate [GC] entities was determined by MALDI-TOF analysis. |
3.2 Characterization of phytosterol dispersions
Dispersions of PS-amph were analyzed by DLS to compare the size distribution of the particles formed by raw mixing (RM) and by antisolvent precipitation (ASP) (Fig. 5). Granulometry indicated that two populations of particles were present in both cases. Both methods generated a first population with a mean diameter of 2 μm, but RM dispersions then generated a second population of 20 μm-diameter particles whereas ASP dispersions generated a second population of 12 μm-diameter particles. The widths of the peaks indicate that the RM particles were more polydispersed than the ASP particles.
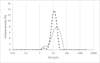 |
Fig. 5 Size distribution of particles generated by the raw-mixing (RM) method (•••) or by antisolvent precipitation (ASP) (− − −) with 1 g/L amphiphilic phytosterols. |
3.3 Evaluation of the capacity to capture methane and carbon dioxide
The partition coefficient values for CH4 and CO2 in several media were compared for the RM dispersions and for the ASP system. Epoxidized soybean oil, commercial olive oil, glycerol carbonate and ethanol were tested in addition to phytosterols dispersions, to compare the different systems.
3.3.1 Raw mixing dispersions (RM)
The affinity of a compound for a given phase can be evaluated by measuring its apparent Henry’s law constant H. This constant links the partial pressure of the compound in the gas phase to its molar fraction in the liquid phase at liquid-vapor equilibrium. As H decreases, the absorption of the compound in the liquid phase increases, reflecting the increase in solubility. CH4 is known to be poorly soluble in water, which is confirmed by its high H value (Fig. 6A). In comparison, CO2 had a much lower H value in water (Fig. 6B). The selectivity defined as the ratio of H(CO2) by H(CH4) was well below 1 (Fig. 6C), which confirms that CO2 is much more soluble in water than CH4.
The value of H was compared between different systems containing phytosterols in water. For RM systems, H(CH4) decreased to 20 kPa m3 mol−1 as opposed to the 57 kPa m3 mol−1 obtained in water, for both RM-native and RM-amph (Fig. 6A). No significant difference was observed between native and amphiphilic phytosterols. In addition, a solution of 50% water and 50% GC was tested to evaluate the influence of GC on H(CH4). An H value of 38 kPa m3 mol−1 was obtained, which is lower than the value obtained for water, but higher than RM-amph. These results indicate that the phytosterol part of the molecule has significantly decreased the H(CH4), thereby improving the affinity of CH4 for the aqueous phase. However, chemical modification of the phytosterol molecule had no influence on H(CH4). Granulometry showed that amphiphilic phytosterol formed monodisperse particles in water whereas native phytosterols dispersions polydisperse with presence large aggregates. We expected the amphiphilic phytosterols to have large surface area which could promote interactions with CH4 resulting in a higher CH4 solubilization. However, the results showed similar H(CH4) value between RM-native and RM-amph suggesting that the hydrophobic terpenic part of the molecule is responsible of the interaction with CH4 and that the presence of polyglycerol on the phytosterol structure has no impact on H(CH4).
In comparison with water, H(CO2) slightly increased in systems containing native phytosterols, PS-amph or GC, with no significant difference between the three systems (Fig. 6B). This result suggests that phytosterols do not increase CO2 solubilization in water. The selectivity S of RM-native and RM-amph systems was higher than water (H2O) and water-GC (50% H2O 50% GC) (Fig. 6C), which reflects a better CH4-CO2 separation due to a higher solubility of CH4 and no change in the solubility of CO2.
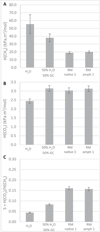 |
Fig. 6 Methane (A) and carbon dioxide (B) absorption and selectivity (C) results for dispersions generated by raw mixing from 1.6% native or amphiphilic phytosterols for RM-native and RM-amph, respectively. |
3.3.2 Antisolvent precipitation system (ASP)
ASP-dispersions were prepared using ethanol at 10 or 50%, which is known to have significant influence on CH4 solubility (García-Aguilar et al., 2011; Lannung and Gjaldbaek, 1960; Wise et al., 2016). For this study we measured H(CH4) and H(CO2) for 10, 50 and 100% ethanol solutions to evaluate this influence (Figs. 7A and 7B). Results showed that ethanol greatly decreased H(CH4) from 57 kPa m3 mol−1 in pure water to 6.2 kPa m3 mol−1 in pure ethanol. However, H(CO2) was slightly higher for 10 and 50% ethanol, and significantly decreased for 100% ethanol. The resulting selectivity increases when ethanol increases (Fig. 7C).
For systems with 10% ethanol, the presence of 1 g/L particles of native phytosterols (ASP-native 1) had no significant effect on H(CH4) or H(CO2) compared with the 10%-ethanol solution (Figs. 8A and 8B). However, the presence of 1 g/L particles of PS-amph (ASP-amph 1) halved the value of H(CH4) and slightly decreased H(CO2). The addition of amphiphilic phytosterol microparticles significantly improved the selectivity of absorption between CH4 and CO2. The nature of the particle seems to have an impact on the interaction with CH4, as ASP-amph particles are covered with polyglycerol groups whereas ASP-native particles are covered with Tween80.
In order to increase the phytosterol concentration beyond 1 g/L, ethanol concentration also had to be increased due to poor solubility of phytosterols. For this reason, ASP-native 5, ASP-amph 5 and ASP amph 15 were composed of 50% ethanol. Dispersions with PS-amph particles (ASP-amph 5 and 15) had similar constants for CH4 and CO2 with values between 27 and 30 kPa m3 mol−1 for H(CH4) and about 2.8 kPa m3 mol−1 for H(CO2) (Figs. 9A and 9B). No significant difference was observed when increasing the particle concentration by 3-fold, and more importantly no significant difference was observed with the control. The presence of particles with amphiphilic phytosterols had no significant impact on CH4 and CO2 solubility compared with the presence of 50% ethanol alone.
For dispersions with native phytosterols (ASP-native 5), the values of H(CH4) and H(CO2), 12.7 kPa m3 mol−1 and 1.2 kPa m3 mol−1, were half those obtained for the corresponding control (Figs. 9A and 9B). The presence of Tween 80 in ASP-native samples may form micelles of surfactant, providing polar and nonpolar environments that increased CH4 solubilization (García-Aguilar et al., 2011). At low surfactant concentration (ASP-native 1), this phenomenon was not observed, but for high concentration (ASP-native 5) CH4 solubility was significantly reduced.
Overall, our observations suggest that the presence of phytosterols increased the affinity of methane for aqueous solutions under certain conditions. One possible reason for this is that methane is adsorbed onto the surface of the particles. On increasing particle concentration, the surface area for adsorption increased as well. We therefore expected to solubilize more CH4 illustrated by a lower H(CH4). However, for PS-amph dispersions, both H(CH4) and H(CO2) remained constant even when particle concentration was multiplied by three. For native phytosterols dispersions, H(CH4) decreased strongly between concentrations of 1 and 5 g/L, but this decrease probably reflects the presence of ethanol and surfactant. Because of the influence of ethanol on CH4 solubility, we cannot evaluate on the impact of higher concentrations of phytosterol particles on CH4 solubilization. More work is necessary to remove ethanol without degrading the particles to study the absorption capacity of these systems with pure particles.
According to the same hypothesis, we also expected that increasing the hydrophilicity of phytosterols would result in a greater surface area available for interactions with CH4. resulting in a decrease in H(CH4) PS-amph. For systems with 10% ethanol, better CH4 solubility was indeed observed when using amphiphilic phytosterols relative to native phytosterols. Again, in systems containing 50% ethanol, no such improvement was observed probably because of the strong ethanol influence on CH4 solubility.
Although phytosterols influenced methane solubility in water, H(CH4) could not be decreased beyond 20 kPa m3 mol−1, unless using other components such as ethanol or Tween80. Phytosterols showed to have specific interaction with CH4 and not with CO2 but systems containing phytosterols had a selectivity for methane of 0.16 at best, where a selectivity greater than 1 would be more convenient for efficient CO2–CH4 separation.
Increasing the concentration and modification of the surface of the particles did not have significant impact on methane solubility. These findings call into question the hypothesis that particles adsorb methane on their surface and suggest that the improvement in the affinity of methane for aqueous systems probably results from another physical phenomenon that could involve solubilization and diffusion.
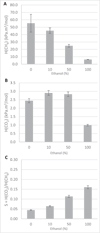 |
Fig. 7 Methane (A) and carbon dioxide (B) absorption and selectivity (C) results for solutions containing different proportions of ethanol in water. |
 |
Fig. 8 Methane (A) and carbon dioxide (B) absorption and selectivity (C) results of solution containing particles and 10% ethanol, comparison with water. |
 |
Fig. 9 Methane (A) and carbon dioxide (C) absorption and selectivity (C) results of solution containing particles and 50% ethanol, comparison with water. |
3.3.3 Raw mixing with oily systems
Finally, we studied the affinity of methane for absorbing phases containing larger amounts of fat, such as a phase containing 20% epoxidized soy oil and another phase consisting of pure olive oil (Fig. 10). Both oils have been reported to contain phytosterols (Yang et al., 2019). The liquid phase containing 20% soy oil decreased H(CH4) to 19.7 kPa m3 mol−1, a similar value compared with RM-native and RM-amph which contained only 1.6% of phytosterols. Pure olive oil was the only absorbing phase that reduced H(CH4) below 10 kPa m3 mol−1. Both oils slightly increased CO2 solubility, but selectivity obtained using olive oil was the highest of all the solution tested in this study.
 |
Fig. 10 Methane (A) and carbon dioxide (B) absorption and selectivity (C) with oils as the absorbing phase. |
4 Conclusion
We used microparticles of phytosterol to improve the solubility of methane in aqueous solution. Amphiphilic phytosterols were synthesized with glycerol carbonate to render them more hydrophilic. Mass spectrometry analyses showed that up to five branches were added to the molecule, and FTIR showed an increase in the number of hydroxyl groups. The objective of this study was to identify a solution to improve CH4 absorption, and to increase the selectivity of absorption between CH4 and CO2. Different dispersions containing phytosterols, dispersed by raw mixing or by antisolvent precipitation, were tested. The presence of these particles of 2–20 μm in diameter in aqueous solutions decreased the apparent partition coefficient of CH4 between gas and liquid. RM dispersions decreased H(CH4) without modifying H(CO2), resulting in a four-fold improvement in selectivity for CH4. ASP dispersions also had a lower H(CH4) and better selectivity if amphiphilic phytosterols were used. We could not evaluate the effect of the phytosterol concentration because of the strong influence of ethanol on CH4 solubilization. Surprisingly, chemical modification of the phytosterol had no significant effect on the improvement in methane solubility when the raw-mixing method was used. When monodisperse particles were formed by antisolvent precipitation, CH4 showed a better affinity with systems containing amphiphilic phytosterols than native phytosterols and Tween 80. Pure olive oil had the best capacity for absorption, with the lowest H(CH4) of all absorbing phases tested in this study. Overall, these results suggest that phytosterols, crude biosourced compounds, are of great interest for CH4 solubilization. The use of phytosterols for this purpose was never reported in the literature before, which makes this approach innovative and useful. Phytosterol particles as additives could help improve existing methods for CH4 capture and CH4-CO2 separation processes instead of petrochemical surfactants.
Conflicts of interest
The authors declare that they have no conflicts of interest in relation to this article.
References
- Alonso A, Moral-Vico J, Abo Markeb A, Busquets-Fité M, Komilis D, Puntes V, Sánchez A, Font X. 2017. Critical review of existing nanomaterial adsorbents to capture carbon dioxide and methane. Sci. Total Environ 595: 51–62. [CrossRef] [Google Scholar]
- Avalos Ramirez A, Jones JP, Heitz M. 2012. Methane treatment in biotrickling filters packed with inert materials in presence of a non-ionic surfactant. J Chem Technol Biotechnol 87: 848–853. [CrossRef] [Google Scholar]
- Benizri D, Dietrich N, Hébrard G. 2017. Experimental characterization of multi-component absorption in complex liquid: New method and apparatus. Chem Eng Sci 170: 116–121. [CrossRef] [Google Scholar]
- Boucher O, Folberth GA. 2010. New directions: atmospheric methane removal as a way to mitigate climate change? Atmos Environ 44: 3343–3345. [CrossRef] [Google Scholar]
- Cai X, Hu YH. 2019. Advances in catalytic conversion of methane and carbon dioxide to highly valuable products. Energy Sci Eng 7: 4–29. [CrossRef] [Google Scholar]
- Carroll JJ, Jou F-Y., Mather AE, Otto FD. 1998. The solubility of methane in aqueous solutions of monoethanolamine, diethanolamine and triethanolamine. Can J Chem Eng 76: 945–951. [CrossRef] [Google Scholar]
- Chappelow CC, Prausnitz JM. 1974. Solubilities of gases in high-boiling hydrocarbon solvents. AIChE J 20: 1097–1104. [CrossRef] [Google Scholar]
- Chen R, Weng G-M. 2023. Sustainable energy resources for driving methane conversion. Adv Energy Mater 13: 2301734. [CrossRef] [Google Scholar]
- Clements JH. 2003. Reactive applications of cyclic alkylene carbonates. Ind Eng Chem Res 42: 663–674. [CrossRef] [Google Scholar]
- Daguet D, Coic J. 1999. Phytosterol extraction: state of the art. OCL − Ol Corps Gras Lipides 6: 25–28. [Google Scholar]
- Folmer BM. 2003. Sterol surfactants: from synthesis to applications. Adv Colloid Interface Sci 103: 99–119. [CrossRef] [PubMed] [Google Scholar]
- Freakley SJ, Dimitratos N, Willock DJ, Taylor SH, Kiely CJ, Hutchings GJ. 2021. Methane oxidation to methanol in water. Acc Chem Res 54: 2614–2623. [CrossRef] [PubMed] [Google Scholar]
- García-Aguilar B, Ramirez A, Jones J, Heitz M. 2011. Solubility of methane in pure non-ionic surfactants and pure and mixtures of linear alcohols at 298 K and 101.3 kPa. Chem Pap 65: 373–379. [Google Scholar]
- Hai M, Han B, Yang G, Yan H, Han Q. 1999. Effect of NaCl, NaOH, and poly(ethylene oxide) on methane solubilization in sodium dodecyl sulfate solutions. Langmuir 15: 1640–1643. [CrossRef] [Google Scholar]
- Hameed A, Ismail IMI, Aslam M, Gondal MA. 2014. Photocatalytic conversion of methane into methanol: performance of silver impregnated WO3. Appl Catal Gen 470: 327–335. [Google Scholar]
- Han B, Su T, Wu H, Gou Z, Xing X-H., Jiang H, Chen Y, Li X, Murrell JC. 2009. Paraffin oil as a “methane vector” for rapid and high cell density cultivation of Methylosinus trichosporium OB3b. Appl Microbiol Biotechnol 83: 669–677. [CrossRef] [PubMed] [Google Scholar]
- Hariz R, JI del Rio Sanz, Mercier C, Valentin R, Dietrich N, Mouloungui Z, Hébrard G. 2017. Absorption of toluene by vegetable oil-water emulsion in scrubbing tower: Experiments and modeling. Chem Eng Sci 157: 264–271. [CrossRef] [Google Scholar]
- Holmiere S, Valentin R, Maréchal P, Mouloungui Z. 2017. Esters of oligo-(glycerol carbonate-glycerol): new biobased oligomeric surfactants. J Colloid Interface Sci 487: 418–425. [CrossRef] [PubMed] [Google Scholar]
- Horn R, Schlögl R. 2015. Methane activation by heterogeneous catalysis. Catal Lett 145: 23–39. [CrossRef] [Google Scholar]
- Hu Y, Ma C, Chen X, Bai G, Guo S. 2022. Hydrophilic phytosterol derivatives: a short review on structural modifications, cholesterol-lowering activity and safety. Grain Oil Sci Technol 5: 146–155. [CrossRef] [Google Scholar]
- Huang Z, Chen M, Wang J, Zhang Y, Zhang L, Wang H, Gao Y, Zhou Y. 2020. Experimental study on methane dissolved in surfactant-alkane system. Int J Min Sci Technol 30: 865–873. [CrossRef] [Google Scholar]
- Huang Z, Zhang Yi, Shao Z, Wang J, Yinghua Zhang, Zhang L, Liu X, Wang H, Zhang M. 2019. Mechanism of the dissolution of methane in the complex micellar system of NaOA/cyclohexane. Arab J Geosci 12: 555. [CrossRef] [Google Scholar]
- King AD. 1992. Solubilization of gases by polyethoxylated lauryl alcohols. J Colloid Interface Sci 148: 142–147. [CrossRef] [Google Scholar]
- Lackner KS. 2020. Practical constraints on atmospheric methane removal. Nat Sustain 3: 357–357. [CrossRef] [Google Scholar]
- Lannung A, Gjaldbaek JChr. 1960. The solubility of methane in hydrocarbons, alcohols, water and other solvents. Acta Chem Scand 14: 1124–1128. [CrossRef] [Google Scholar]
- Lee J-W., Balathanigaimani MS, Kang H-C., Shim W-G., Kim C, Moon H. 2007. Methane storage on phenol-based activated carbons at (293.15, 303.15, and 313.15) K. J Chem Eng Data 52: 66–70. [CrossRef] [Google Scholar]
- Llewellyn PL, Bourrelly S, Serre C, Vimont A, Daturi M, Hamon L, De Weireld G, Chang J-S., Hong D-Y., Kyu Hwang Y, Hwa Jhung S, Férey G. 2008. High uptakes of CO2 and CH4 in mesoporous metal—organic frameworks MIL-100 and MIL-101. Langmuir 24: 7245–7250. [CrossRef] [PubMed] [Google Scholar]
- Mouloungui Z, Marechal P, Truong DN. 2006. Polycarbonate de glycerol − compositions organiques le contenant − procede d’obtention de ces compositions organiques et procede d’extraction du polycarbonate de glycerol et leurs applications. FR2874217B1. [Google Scholar]
- Ochoa-Gómez JR, Gómez-Jiménez-Aberasturi O, Ramírez-López C, Belsué M. 2012. A brief review on industrial alternatives for the manufacturing of glycerol carbonate, a green chemical. Org Process Res Dev 16: 389–399. [CrossRef] [Google Scholar]
- Patel SKS, Kalia VC, Joo JB, Kang YC, Lee J-K. 2020. Biotransformation of methane into methanol by methanotrophs immobilized on coconut coir. Bioresour Technol 297: 122433. [CrossRef] [PubMed] [Google Scholar]
- Periana RA, Mironov O, Taube D, Bhalla G, Jones CJ. 2003. Catalytic, oxidative condensation of CH4 to CH3COOH in one step via CH activation. Science 301: 814–818. [CrossRef] [PubMed] [Google Scholar]
- Rossi L, Seijen ten Hoorn JWM, Melnikov SM, Velikov KP. 2010. Colloidal phytosterols: synthesis, characterization and bioaccessibility. Soft Matter 6: 928–936. [CrossRef] [Google Scholar]
- Saha D, Bao Z, Jia F, Deng S. 2010. Adsorption of CO2, CH4, N2O, and N2 on MOF-5, MOF-177, and Zeolite 5A. Environ Sci Technol 44: 1820–1826. [Google Scholar]
- Sander R. 2008. Methane [WWW Document]. Natl Inst Stand Technol URL https://webbook.nist.gov/cgi/cbook.cgi?ID=C74828&Mask=10 ( accessed 11.24.23). [Google Scholar]
- Skutil K, Taniewski M. 2006. Some technological aspects of methane aromatization (direct and via oxidative coupling). Fuel Process Technol 87: 511–521. [CrossRef] [Google Scholar]
- Sonnati MO, Amigoni S, Taffin de Givenchy EP, Darmanin T, Choulet O, Guittard F. 2013. Glycerol carbonate as a versatile building block for tomorrow: synthesis, reactivity, properties and applications. Green Chem 15: 283–306. [CrossRef] [Google Scholar]
- Tang P, Zhu Q, Wu Z, Ma D. 2014. Methane activation: the past and future. Energy Environ Sci 7: 2580–2591. [CrossRef] [Google Scholar]
- Valentin R, Mouloungui Z. 2013. Superhydrophilic surfaces from short and medium chain solvo-surfactants. Ol Corps Gras Lipides 20: 33–44. [CrossRef] [EDP Sciences] [Google Scholar]
- Wise M, Chapoy A, Burgass R. 2016. Solubility measurement and modeling of methane in methanol and ethanol aqueous solutions. J Chem Eng Data 61: 3200–3207. [CrossRef] [Google Scholar]
- Yang R, Xue L, Zhang L, Xuefang Wang, Qi X, Jiang J, Yu L, Xiupin Wang, Zhang W, Zhang Q, Li P. 2019. Phytosterol contents of edible oils and their contributions to estimated phytosterol intake in the Chinese diet. Foods 8: 334. [CrossRef] [PubMed] [Google Scholar]
- Yoo J-W., Mouloungui Z, Gaset A. 2001. Method for producing an epoxide, in particular of glycidol, and installation for implementation. US6316641B1. [Google Scholar]
- Zhou L, Sun Y, Yang Z, Zhou Y. 2005. Hydrogen and methane sorption in dry and water-loaded multiwall carbon nanotubes. J Colloid Interface Sci 289: 347–351. [CrossRef] [PubMed] [Google Scholar]
- Zhou Z, Zhu S, Gong J, Zhu M, Luo W. 2018. Experimental study on methane solubilization by organic surfactant aggregates. Chem Pap 72: 1467–1475. [CrossRef] [Google Scholar]
Cite this article as: Gallard J, Wantz E, Hébrard G, Bouchoux A, Mouloungui Z, Valentin R. 2025. Use of suspensions of phytosterol microparticles to improve the solubility of methane in water. OCL 32: 1
All Figures
|
Fig. 1 Reaction mechanisms for 5-membered carbonate ring opening (Ochoa-Gómez et al., 2012). |
| In the text | |
|
Fig. 2 Chemical pathway and expected molecules. |
| In the text | |
|
Fig. 3 FTIR spectra of (A) native phytosterols, (B) glycerol carbonate, (C) amphiphilic phytosterols synthesized. |
| In the text | |
|
Fig. 4 Degree of polymerization of amphiphilic phytosterols. Number of glycerol [G] and glycerol carbonate [GC] entities was determined by MALDI-TOF analysis. |
| In the text | |
|
Fig. 5 Size distribution of particles generated by the raw-mixing (RM) method (•••) or by antisolvent precipitation (ASP) (− − −) with 1 g/L amphiphilic phytosterols. |
| In the text | |
|
Fig. 6 Methane (A) and carbon dioxide (B) absorption and selectivity (C) results for dispersions generated by raw mixing from 1.6% native or amphiphilic phytosterols for RM-native and RM-amph, respectively. |
| In the text | |
|
Fig. 7 Methane (A) and carbon dioxide (B) absorption and selectivity (C) results for solutions containing different proportions of ethanol in water. |
| In the text | |
|
Fig. 8 Methane (A) and carbon dioxide (B) absorption and selectivity (C) results of solution containing particles and 10% ethanol, comparison with water. |
| In the text | |
|
Fig. 9 Methane (A) and carbon dioxide (C) absorption and selectivity (C) results of solution containing particles and 50% ethanol, comparison with water. |
| In the text | |
|
Fig. 10 Methane (A) and carbon dioxide (B) absorption and selectivity (C) with oils as the absorbing phase. |
| In the text | |
Current usage metrics show cumulative count of Article Views (full-text article views including HTML views, PDF and ePub downloads, according to the available data) and Abstracts Views on Vision4Press platform.
Data correspond to usage on the plateform after 2015. The current usage metrics is available 48-96 hours after online publication and is updated daily on week days.
Initial download of the metrics may take a while.