")
")
| Issue |
OCL
Volume 25, Number 6, November-December 2018
|
|
|---|---|---|
| Article Number | D603 | |
| Number of page(s) | 7 | |
| Section | New ideotypes of oil & protein crops / Nouveaux idéotypes d’oléoprotéagineux | |
| DOI | https://doi.org/10.1051/ocl/2018047 | |
| Published online | 07 September 2018 | |
Research Article
Improving seed oil and protein content in Brassicaceae: some new genetic insights from Arabidopsis thaliana
Améliorer le contenu en huile et en protéines des brassicacées : de nouvelles perspectives génétiques
1
Institut Jean-Pierre Bourgin, INRA, AgroParisTech, CNRS, Université Paris-Saclay,
78000
Versailles, France
2
Institut de Génétique, Environnement et Protection des Plantes, INRA, Agrocampus Ouest, Univ. Rennes,
35650
Le Rheu, France
* Correspondance: This email address is being protected from spambots. You need JavaScript enabled to view it.
Received:
8
June
2018
Accepted:
23
August
2018
Abstract
Western Europe oleoproteaginous species like rapeseed mainly accumulate oil and protein in their seeds. To become competitive with soybean, seed protein quantity and quality should be improved in rapeseed. The negative correlation existing between seed protein and oil content apparently prevents the possibility to increase protein content without affecting oil content. Exploration of natural and induced genetic variability in the model plant Arabidopsis thaliana allows the identification of several genotypes impaired in this negative correlation. Different genetic approaches have been undertaken in order to isolate genetic factors responsible for the tight control of seed oil and protein homeostasis and this negative correlation. Once isolated in this model plant, such genetic determinants will be identified in important crops such as rapeseed or other oilseed crops in order to manipulate both components independently and thus produce on purposed seeds. In the long term, this research will help breed new varieties that could contribute to reduce Europe’s dependence on US soybean import.
Résumé
Les espèces oléoprotéagineuses d’Europe de l’Ouest comme le colza accumulent principalement de l’huile et des protéines dans leurs graines. Il est nécessaire d’améliorer la quantité et la qualité des protéines des graines de colza afin que son tourteau puisse concurrencer celui du soja. Cependant, la corrélation négative existant entre les teneurs en protéines et en huile des graines représente un obstacle pour augmenter la teneur en protéines sans affecter la teneur en huile. L’exploration de la variabilité génétique naturelle et induite chez la plante modèle Arabidopsis thaliana permet d’identifier plusieurs génotypes altérés dans cette corrélation négative. Différentes approches ont été entreprises afin d’isoler les facteurs génétiques responsables du contrôle de l’homéostasie entre l’huile et les protéines des graines et de cette corrélation négative. Une fois isolés chez cette plante modèle, ces déterminants génétiques seront identifiés chez des espèces agronomiques telles que le colza ou d’autres oléagineux afin de manipuler les deux composants de manière indépendante et de produire ainsi des variétés adaptées aux différents besoins. À long terme, ce type de recherche permettra de sélectionner de nouvelles variétés qui pourraient contribuer à réduire la dépendance de l’Europe à l’égard des importations de soja américain.
Key words: oil / protein / seed / genetic / brassicaceae
Mots clés : huile / protéines / graine / génétique / brassicacées
© S. Jasinski et al., Published by EDP Sciences, 2018
 This is an Open Access article distributed under the terms of the Creative Commons Attribution License (http://creativecommons.org/licenses/by/4.0), which permits unrestricted use, distribution, and reproduction in any medium, provided the original work is properly cited.
1 Introduction
Seed storage compounds are of crucial importance for human diet, feed and industrial uses, as they are mainly composed of starch, proteins and oil. In oleo-proteaginous species like rapeseed/canola, seed oil was to date the main qualitative determinant that conferred economic value to the harvested seed. This oil is used for human consumption and for oleo-chemistry since it constitutes excellent alternatives to fossil carbon-based products. Nevertheless, it is imperative that these industrial uses do not affect feed/food resources.
In 2030, the world will have to feed 8.4 billion people, i.e. 22% more than in 2010 (United Nation, https://www.un.org/development/desa/publications/world-population-prospects-the-2017-revision.html). Population growth and rising living standards will lead to a diversification of diets in all regions of the world, resulting in an increase in oil and protein consumption. Thus, between 2010 and 2030, an increase of nearly 40% in the food demand for oil is expected, to which would be added a moderate additional demand for industrial uses (+8 to 11%). For plant proteins, the food demand will increase by almost 43%, mainly due to the first nutritional transition still operating in South Asia and sub-Saharan Africa (increase of fruit and vegetable consumption) and to the second nutritional transition (healthier overall diet, i.e. more vegetable and less meat) operating in Europe, North America and Oceania (http://www.terresunivia.fr/sites/default/files/articles/publications/brochures/2016%2006%2016%20-%20BIPE%20%26%20SOFIPROTEOL_GlobalOutlook_bd.pdf). At the same time, a 33% increase in animal protein demand will come from developing countries (mainly East Asia) to achieve their first nutritional transition (increase of meat consumption), which will also have a significant impact on world oleo-proteaginous seed meal demand for animal feed (+53%).
On the supply side, vegetable oil resources could more or less meet food, energy and chemical demands. However, a deficit in meal of 58 Mt is forecast in 2030 (http://www.terresunivia.fr/sites/default/files/articles/publications/brochures/2016%2006%2016%20-%20BIPE%20%26%20SOFIPROTEOL_GlobalOutlook_bd.pdf) thus limiting meat consumption. Currently, the production of vegetable proteins for animal feed in Europe is in short supply. Consequently, improving crop yield, and in particular protein yield, is still a major challenge for the European agriculture and this has to be achieved while reducing the agricultural inputs to minimise the environmental impact of this increased production (Durrett et al., 2008). Oleo-proteaginous cultures, like rapeseed, sunflower and soybean are good candidates to increase plant protein production, but keeping in mind that soybean cultivation is not adapted to northern European regions. European Union (EU) produces about 21 Million tonnes (Mt) of oleo-proteaginous meals, mainly from these three species, however EU imports more than 70% (mainly soybean from Brazil and United States) of its need to feed its livestock (de Visser et al., 2014). Furthermore, rapeseed meal has to compete with soymeal, which contains higher level and better quality of proteins in terms of essential amino-acid composition and digestibility. In this context, improving rapeseed meal quality and quantity is a challenge in Western Europe, where rapeseed is the main cultivated oleo-proteaginous crop. Of course, this should be achieved with regards to seed yield and also to high oil content and quality (fatty acid balance) in rapeseed. During the last four decades in the developed countries, genetic gain was an important leverage to raise rapeseed yield. However, since 1990, this genetic gain yield has slowed down and the current very strong constraints on non-renewable nitrogen inputs further stress this situation. In this context, we know that breakthroughs are needed to bring novel innovative solutions and plant research has to play a major role in this challenge.
The metabolic pathways for the production of storage proteins and oil are already well described and genes encoding the key enzymes of these pathways have been identified in several oleo-proteaginous species (Shewry et al., 1995; Ohlrogge and Jaworski, 1997; Baud et al., 2008; Baud and Lepiniec, 2010). However, the genes and mechanisms determining the differential partitioning of seed reserves into the major storage components remain largely unknown. These factors are of fundamental importance for the successful engineering – whether it would be by classical breeding or not – of high-yield crops by regulating the production and partitioning of storage compounds.
In addition, a strong negative correlation between oil and protein accumulation has been observed in protein-storing seeds like soybean (Chung et al., 2003), as well as in oil-storing seeds like rapeseed (Grami et al., 1977; Jolivet et al., 2013), sunflower (Li et al., 2017) or the model plant Arabidopsis thaliana (Fig. 4), suggesting that seed filling in these species is highly constrained and that manipulating both components independently may be difficult. This was confirmed by QTL/GWAS studies in these species, in which oil and protein QTL often co-localise but display inverse effect, as expected due to balance between the two main compounds of the seed (Chung et al., 2003; Nichols et al., 2006; Bouchet et al., 2014; Hwang et al., 2014; Jasinski et al., 2016). In addition, some attempts to separate oil and protein QTL in soybean were unsuccessful (Chung et al., 2003; Nichols et al., 2006), reinforcing the hypothesis that the same genes are controlling both traits. However, some results are not in complete agreement with this assertion. Indeed, a SNP at which one allele was associated with both higher protein and oil content was identified in soybean (Hwang et al., 2014) and QTL specific of oil content or protein content were identified in rapeseed as well as in Arabidopsis (Bouchet et al., 2014; Jasinski et al., 2016). These QTL are of great interest for improving both traits independently. Moreover, in Arabidopsis, mutant studies have shown that a decrease in the amount of seed protein or oil does not necessarily lead to a compensating increase in the other storage compounds (Finkelstein and Somerville, 1990; Focks and Benning, 1998), suggesting that protein and oil biosynthesis pathways can be disconnected.
Thus it is of interest to understand why there is such a strong negative correlation between oil and protein accumulation in seed and how to break, or at least weaken, this link in order to manage both components independently.
The first step to address this issue is to identify the genetic factors responsible of the tight control of seed oil and protein relative accumulation in oleo-proteaginous species. In a second step, functional analysis of these genes should help understanding this negative correlation and thus provide the tools to manipulate the oil/protein ratio.
At IJPB in Versailles, this question was tackled in Arabidopsis thaliana (Fig. 1) for several reasons. First, it is a species of the same family as rapeseed (Brassicaceae), their seed metabolisms are very similar (Niu et al., 2009) and the close genetic relationship between them allows using comparative genetics to predict orthologous genes and alleles within the Brassica genome (Parkin et al., 2005; Sharma et al., 2014). Second, it is a small plant with a small genome, producing several thousand seeds (thousand seed weight of about 20 mg) in 4 months and easily genetically transformable by floral dipping. For these reasons, it has been chosen as a model organism in plant biology. Consequently, substantial genetic resources are available (notably large collections of natural accessions, recombinant inbred line populations or mutant collections, T-DNA insertion or chemical mutagenesis, giving access to considerable genetic variability), as well as genomic resources (many accessions are sequenced or benefit from very dense physical mapping).
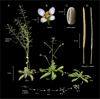 |
Fig. 1 Arabidopsis thaliana. (A) A. thaliana at different stages of its life cycle. (B) A. thaliana flower, (C) pollen grain (scanning electron micrograph) and (D) mature siliques (seed pods; left: closed; right: open with a few remaining unshattered seeds) (adapted from Krämer, 2015). |
2 Exploration of the variability of oil and protein contents in Arabidopsis
Seed oil and protein contents are quantitative traits whose variation results from the effect of many genes, the environment (climate, agriculture practices…) and the interactions of these genes with the environment. The amplitude of the variation of these two traits within the Arabidopsis species was studied and their heritability under globally controlled growth conditions was evaluated.
The IJPB Biological Resource Center 48 core-collection of Arabidopsis, in addition to the Col-0 accession and minisets of 20 lines from 8 RIL (Recombinant Inbred Lines, populations https://www.observatoire-vegetal.inra.fr/observatoire-vegetal_eng/Scientific-platforms/Arabidopsis-Stock-Center) were cultivated. The choice of these lines was made to minimize the number of plants to grow while maintaining as wide as possible the genetic variability (Simon et al., 2008). Each genotype was cultivated in triplicate and three successive and independent cultures were performed in growth chambers with similar global climatic conditions. For each culture, the 624 plants (208 genotypes in 3 replicates) were grown in the same growth chamber, in randomized blocks and moved every other day in “pilgrim steps” in order to minimize the climatic heterogeneity of the growth chamber due to the fact that Arabidopsis is sensitive to climatic variations at centimetric scale.
In parallel, a fast, accurate, and high throughput method, based on near infrared spectrometry (NIRS), to measure Arabidopsis seed oil, protein, carbon and nitrogen contents was developed at IJPB (Jasinski et al., 2016). The development of a NIRS model consists in correlating the NIRS spectra of 100–150 samples with their actual compound content obtained by a reference method, in general labour intensive and time-consuming. Once set-up, the model allows the estimation of the compound content from any seed sample spectrum (less than 200 mg of seeds – 8 to 10 000 seeds). In addition, this measure is non-destructive and does not alter seed viability.
NIRS phenotyping of the 1872 seed samples from the three cultures showed that Arabidopsis seed oil and protein contents displayed a wide range of variation (Fig. 2). In order to quantify the relative contribution of the genotype (G), the environment (E) and the G × E interaction on the variation of these traits, a global analysis of variance (ANOVA) was carried out on the measures from the three cultures (Fig. 3). It shows that, under our growth conditions, the studied traits are under the control of genetic factors but also depend on the environment. The representation of all these data on a scattered plot allowed us to confirm the negative correlation existing between seed oil and protein contents (Fig. 4). For these studies, the most interesting genotypes are those located at the periphery of the scatter plot. This is obviously the case for genotypes close to the regression line but showing high or low O/P ratio (respectively genotypes corresponding to yellow and blue points in Fig. 4). It can also be noticed that, even though most of the genotypes are close to the P/O regression line, in agreement with seed oil and protein contents being tightly correlated, some genotypes are distant from this regression line, suggesting that this correlation have been removed or relaxed. These genotypes “break” the negative correlation usually observed between oil and protein contents. Indeed, the contents being expressed in percentage of dry seed weight, this indicates that the genotypes “above” the regression line produce seeds with more oil than the “classical line” for a given protein content or more proteins than expected for a given oil content (genotypes corresponding to pink points in Fig. 4). Conversely, genotypes “below” the regression line produce seeds with less oil than expected for a given protein content or less proteins than expected for a given oil content (genotypes corresponding to brown points in Fig. 4). The identification of the genetic factors contributing to this distinct pattern could help when defining new ideotypes for oilseed Brassicaceae and breeding for them.
As mentioned, for a given oil (or protein) value, lines encircled in brown in Figure 4 display a lower oil + protein amount than lines close to the regression line and the opposite is true for lines encircled in pink. This means that one (or more) other component(s) of the seed should significantly vary between these extreme lines. Therefore the analysis and quantification of the other compounds of Arabidopsis seed, in particular carbohydrates, were undertaken in order to find at least one molecular “marker” that can be used to characterize these lines. Ideally, a NIRS model could then be developed to measure the content of this marker easily and at high throughput level.
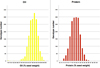 |
Fig. 2 Frequency distribution of seed oil and protein content of 1872 Arabidopsis plants. Frequency distributions of oil and protein content mean values for 208 genotypes in triplicate from three independent cultures and corresponding to Arabidopsis accessions and RILs from eight populations. |
 |
Fig. 3 Variance component analysis for seed oil and protein contents. An ANOVA was performed for seed oil and protein content on 208 genotypes cultivated three times. Histograms show the effects due to genotype, environment, interaction genotype × environment (G × E) and the residual as a percentage of the variation explained. |
 |
Fig. 4 Seed oil and protein % are negatively correlated. Graph shows the average seed oil and protein content (% of dry seed weight) of 208 Arabidopsis genotypes including RIL from 3 populations and a core-collection of 48 accessions (3 replicates/genotype). All genotypes were grown in one experiment. The black line corresponds to the protein/oil (P/O) regression line. The focus on some remarkable genotypes, corresponding to the highlighted points of different colours, is discussed in the text. |
3 Effect of the environment on seed filling
There is an obvious effect of the environment on seed filling, even in Arabidopsis cultivated under controlled conditions (Fig. 3). Moreover the negative correlation is also affected, as illustrated with the three cultures performed under nearly identical climatic conditions (Fig. 5).
The major difficulty in identifying and cloning genes for quantitative traits that are strongly influenced by the environment lies in the accuracy and especially the repeatability of phenotyping. At IJPB, phenotyping robots (Phenoscope, Tisne et al. (2013) and http://www7.inra.fr/vast/Files/PhenoFilm.avi) allow to grow several hundred plants simultaneously on a reduced area, moving sequentially the plants so that they all occupy, successively, the same position in the growth chamber during the same duration. Consequently, their phenotype mainly reflects differences due to variation of their genotype and not those due to variation of the environment. It is thus possible to repeat experiments under identical climatic global conditions, a very important point for validating and cloning genetic determinants. While the first version of the Phenoscopes only allows growing Arabidopsis plants until rosette stage, we are currently building an XL Phenoscope that will allow growing Arabidopsis during its all life cycle (“from seed to seed”). Such a device should improve the phenotyping power of our traits of interest and consequently help to identify more quickly and with greater precision the genes involved.
In addition, Phenoscope makes also possible to set up complex experimental designs combining several factors in order, for example, to study the effect of abiotic stresses (such as drought and/or nitrogen constraint) on oil and protein accumulation as well as on the slope of the P/O regression line. Indeed, different climatic/nutritional scenari can easily be applied using this tool.
 |
Fig. 5 Scatter plot of seed oil and protein content (% of dry seed weight) of 650 Arabidopsis genotypes cultivated in tree independent cultures. Each culture, as well as the corresponding regression line is represented by a different colour. |
4 Strategies used to identify genetic factors involved in seed filling
In order to understand how oil and protein are partitioned in Brassicaceae seeds, it is necessary to isolate the genes involved in this tight regulatory process. In addition, understanding how plants cope with a broken P/O negative correlation should allow manipulating accumulation of the storage compounds independently of each other.
To this end, quantitative genetic approaches such as Quantitative Trait Loci (QTL) cloning and Genome Wide Association Studies (GWAS) have been undertaken.
For that purpose, four Arabidopsis RIL populations and a GWAS collection of about 300 Swedish accessions (https://gwas.gmi.oeaw.ac.at/) have been grown and phenotyped by NIRS. QTL for seed oil and protein contents have been identified in the four populations (Jasinski et al., 2016 and unpublished results) and some are currently fine-mapped in order to identify the genes.
In addition, a forward genetic approach has been undertaken, taking advantage of a collection of about 500 homozygous mutants (obtained after chemical EMS mutagenesis of the Arabidopsis Col-0 accession and made homozygous after 5 successive generations of Single Seed Descent). The seeds of these lines, which present an almost total level of homozygosity, were phenotyped by NIRS. These lines display a wide range of oil and protein content, similar to the one of natural accessions (Fig. 6). Several of them, displaying interesting phenotype (high and low O/P ratio, broken P/O negative correlation) have been selected (Fig. 6). Mapping-by-sequencing is in progress in order to identify the genes responsible for their phenotype.
We therefore hope, through all the approaches and resources developed, to isolate genetic factors involved in the tight control of reserve compound relative accumulation in Arabidopsis seed. Functional analysis of these genes should help elucidate the molecular mechanisms involved during seed filling. These functional analyses will also give us information on the role of these genes on seed physiology and quality (size, viability, germination, longevity, yield) and it will be possible to test the effects of different inputs (nitrogen nutrition, water availability) on plants carrying different alleles of these genes. The ultimate objective of these studies is of course to finally identify these genetic determinants in important crops such as rapeseed or other oilseed crops in order to create ideotypes that better meet the current needs of European agriculture and consumers.
 |
Fig. 6 Seed oil and protein content (% of dry seed weight) of 591 Arabidopsis EMS mutant lines derived from the same homozygous line. Selected mutant lines with remarkable storage content are red circled. |
Acknowledgements
The IJPB benefits from the support of the LabEx Saclay Plant Sciences-SPS (ANR-10-LABX-0040-SPS). IJPB and IGEPP were supported by Promosol.
References
- Baud S, Lepiniec L. 2010. Physiological and developmental regulation of seed oil production. Prog Lipid Res 49: 235–249. doi: 10.1016/j.plipres.2010.01.001. [CrossRef] [PubMed] [Google Scholar]
- Baud S, Dubreucq B, Miquel M, Rochat C, Lepiniec L. 2008. Storage reserve accumulation in Arabidopsis: metabolic and developmental control of seed filling. Arabidopsis book / Am Soc Plant Biol 6: e0113. doi: 10.1199/tab.0113. [CrossRef] [Google Scholar]
- Bouchet AS, Nesi N, Bissuel C, et al. 2014. Genetic control of yield and yield components in winter oilseed rape (Brassica napus L.) grown under nitrogen limitation. Euphytica 199: 183–205. doi: 10.1007/s10681-014-1130-4. [Google Scholar]
- Chung J, Babka HL, Graef GL, et al. 2003. The seed protein, oil, and yield QTL on soybean linkage group I. Crop Sci 43: 1053–1067. doi: 10.2135/cropsci2003.1053. [Google Scholar]
- de Visser CLM, Schreuder R, Stoddard F. 2014. The EU’s dependency on soya bean import for the animal feed industry and potential for EU produced alternatives. OCL 21: D407. [CrossRef] [EDP Sciences] [Google Scholar]
- Durrett TP, Benning C, Ohlrogge J. 2008. Plant triacylglycerols as feedstocks for the production of biofuels. Plant J 54: 593–607. doi: 10.1111/j.1365-313X.2008.03442.x. [CrossRef] [PubMed] [Google Scholar]
- Finkelstein RR, Somerville CR. 1990. Three classes of abscisic acid (ABA)-insensitive mutations of arabidopsis define genes that control overlapping subsets of ABA responses. Plant Physiol 94: 1172–1179. doi: 10.1104/pp.94.3.1172. [Google Scholar]
- Focks N, Benning C. 1998. wrinkled1: A novel, low-seed-oil mutant of Arabidopsis with a deficiency in the seed-specific regulation of carbohydrate metabolism. Plant Physiol 118: 91–101. doi: 10.1104/pp.118.1.91. [Google Scholar]
- Grami B, Baker RJ, Stefansson BR. 1977. Genetics of protein and oil content in summer rape– heritability, number of effective factors, and correlations. Can J Plant Sci 57: 937–943. doi: 10.4141/cjps77-134. [Google Scholar]
- Hwang EY, Song Q, Jia G, et al. 2014. A genome-wide association study of seed protein and oil content in soybean. BMC Genom 15: 1. doi: 10.1186/1471-2164-15-1. [CrossRef] [Google Scholar]
- Jasinski S, Lecureuil A, Durandet M, Bernard-Moulin P, Guerche, P. 2016. Arabidopsis seed content QTL mapping using high-throughput phenotyping: The assets of near infrared spectroscopy. Front Plant Sci 7: 1682. doi: 10.3389/fpls.2016.01682. [CrossRef] [PubMed] [Google Scholar]
- Jolivet P, Deruyffelaere C, Boulard C, et al. 2013. Deciphering the structural organization of the oil bodies in the Brassica napus seed as a mean to improve the oil extraction yield. Ind Crops Prod 44: 549–557. doi: 10.1016/j.indcrop.2012.09.024. [Google Scholar]
- Krämer U. 2015. The natural history of model organisms: Planting molecular functions in an ecological context with Arabidopsis thaliana. Elife 4. doi: 10.7554/eLife.06100. [Google Scholar]
- Li WP, Shi HB, Zhu K, Zheng Q, Xu Z. 2017. The quality of sunflower seed oil changes in response to nitrogen fertilizer. Agron J 109: 2499–2507. doi: 10.2134/agronj2017.01.0046. [Google Scholar]
- Nichols DM, Glover KD, Carlson SR, Specht JE, Diers BW. 2006. Fine mapping of a seed protein QTL on soybean linkage group I and its correlated effects on agronomic traits. Crop Science 46: 834–839. doi: 10.2135/cropsci205.05-0168. [Google Scholar]
- Niu Y, Wu GZ, Ye R, et al. 2009. Global analysis of gene expression profiles in Brassica napus developing seeds reveals a conserved lipid metabolism regulation with Arabidopsis thaliana. Mol Plant 2: 1107–1122. doi: 10.1093/mp/ssp042. [CrossRef] [PubMed] [Google Scholar]
- Ohlrogge JB, Jaworski JG. 1997. Regulation of fatty acid synthesis. Annu Rev Plant Physiol Plant Mol Biol 48: 109–136. doi: 10.1146/annurev.arplant.48.1.109. [CrossRef] [PubMed] [Google Scholar]
- Parkin IA, Gulden SM, Sharpe AG, et al. 2005. Segmental structure of the Brassica napus genome based on comparative analysis with Arabidopsis thaliana. Genetics 171: 765–781. doi: 10.1534/genetics.105.042093. [CrossRef] [PubMed] [Google Scholar]
- Sharma A, Li X, Lim YP. 2014. Comparative genomics of Brassicaceae crops. Breed Sci 64: 3–13. doi: 10.1270/jsbbs.64.3. [CrossRef] [PubMed] [Google Scholar]
- Shewry PR, Napier JA, Tatham AS. 1995. Seed storage proteins: structures and biosynthesis. The Plant cell 7: 945–956. doi: 10.1105/tpc.7.7.945. [CrossRef] [PubMed] [Google Scholar]
- Simon M, Loudet O, Durand S, et al. 2008. Quantitative trait loci mapping in five new large recombinant inbred line populations of Arabidopsis thaliana genotyped with consensus single-nucleotide polymorphism markers. Genetics 178: 2253–2264. doi: 10.1534/genetics.107.083899. [CrossRef] [PubMed] [Google Scholar]
- Tisne S, Serrand Y, Bach L, Gilbault E, Ben Ameur R, et al. 2013. Phenoscope: an automated large-scale phenotyping platform offering high spatial homogeneity. Plant J. doi: 10.1111/tpj.12131. [Google Scholar]
Cite this article as: Jasinski S, Chardon F, Nesi N, Lécureuil A, Guerche P. 2018. Improving seed oil and protein content in Brassicaceae: some new genetic insights from Arabidopsis thaliana. OCL 25(6): D603.
All Figures
|
Fig. 1 Arabidopsis thaliana. (A) A. thaliana at different stages of its life cycle. (B) A. thaliana flower, (C) pollen grain (scanning electron micrograph) and (D) mature siliques (seed pods; left: closed; right: open with a few remaining unshattered seeds) (adapted from Krämer, 2015). |
| In the text | |
|
Fig. 2 Frequency distribution of seed oil and protein content of 1872 Arabidopsis plants. Frequency distributions of oil and protein content mean values for 208 genotypes in triplicate from three independent cultures and corresponding to Arabidopsis accessions and RILs from eight populations. |
| In the text | |
|
Fig. 3 Variance component analysis for seed oil and protein contents. An ANOVA was performed for seed oil and protein content on 208 genotypes cultivated three times. Histograms show the effects due to genotype, environment, interaction genotype × environment (G × E) and the residual as a percentage of the variation explained. |
| In the text | |
|
Fig. 4 Seed oil and protein % are negatively correlated. Graph shows the average seed oil and protein content (% of dry seed weight) of 208 Arabidopsis genotypes including RIL from 3 populations and a core-collection of 48 accessions (3 replicates/genotype). All genotypes were grown in one experiment. The black line corresponds to the protein/oil (P/O) regression line. The focus on some remarkable genotypes, corresponding to the highlighted points of different colours, is discussed in the text. |
| In the text | |
|
Fig. 5 Scatter plot of seed oil and protein content (% of dry seed weight) of 650 Arabidopsis genotypes cultivated in tree independent cultures. Each culture, as well as the corresponding regression line is represented by a different colour. |
| In the text | |
|
Fig. 6 Seed oil and protein content (% of dry seed weight) of 591 Arabidopsis EMS mutant lines derived from the same homozygous line. Selected mutant lines with remarkable storage content are red circled. |
| In the text | |
Current usage metrics show cumulative count of Article Views (full-text article views including HTML views, PDF and ePub downloads, according to the available data) and Abstracts Views on Vision4Press platform.
Data correspond to usage on the plateform after 2015. The current usage metrics is available 48-96 hours after online publication and is updated daily on week days.
Initial download of the metrics may take a while.