")
")
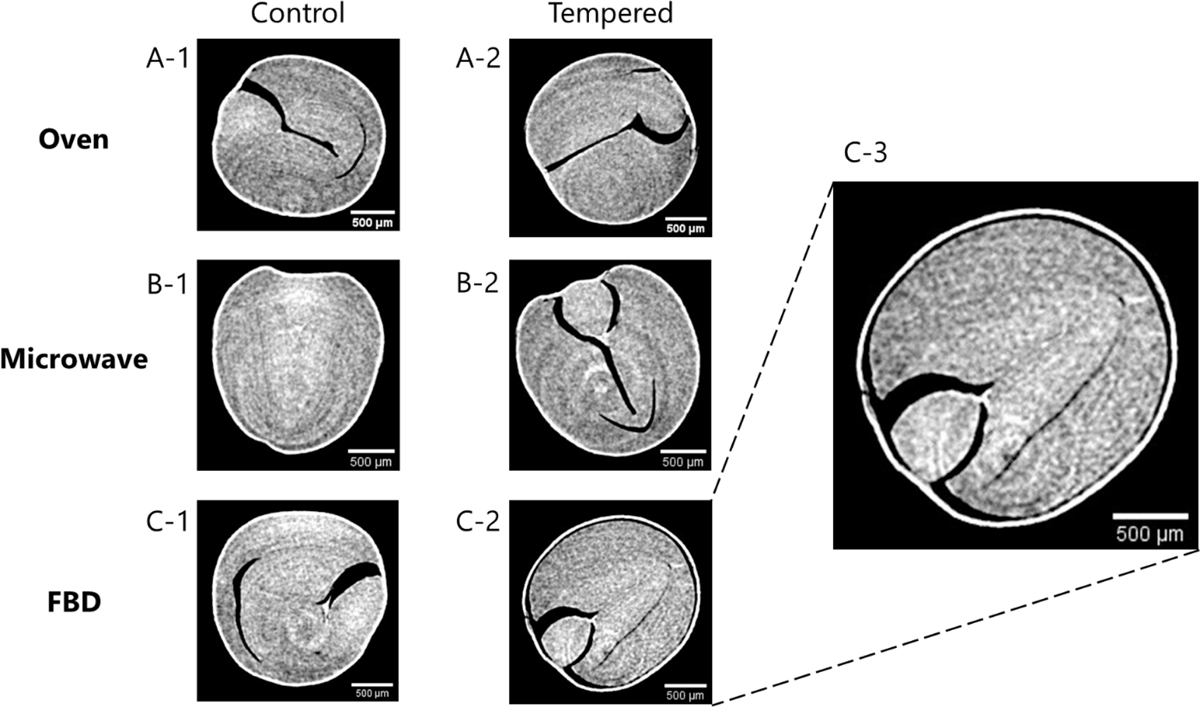
Fig. 5
Download original image
2D micro-CT scans of three different canola seeds, each preconditioned with a different treatment. The 2D scans depicted on the tempered column were taken from the same seed depicted on the control column. The only difference between both columns is that control scans were taken before treatment and tempered after preconditioning. A-1 and A-2 correspond to a seed tempered using the oven method; B-1 and B-2 correspond to a seed tempered using the microwave method; and C-1 and C-3 correspond to a seed tempered using the FBD method. C-3 is the same image as C-2 but enlarged to better visualize the gap between the hull and the embryo.
Current usage metrics show cumulative count of Article Views (full-text article views including HTML views, PDF and ePub downloads, according to the available data) and Abstracts Views on Vision4Press platform.
Data correspond to usage on the plateform after 2015. The current usage metrics is available 48-96 hours after online publication and is updated daily on week days.
Initial download of the metrics may take a while.