")
")
Open Access
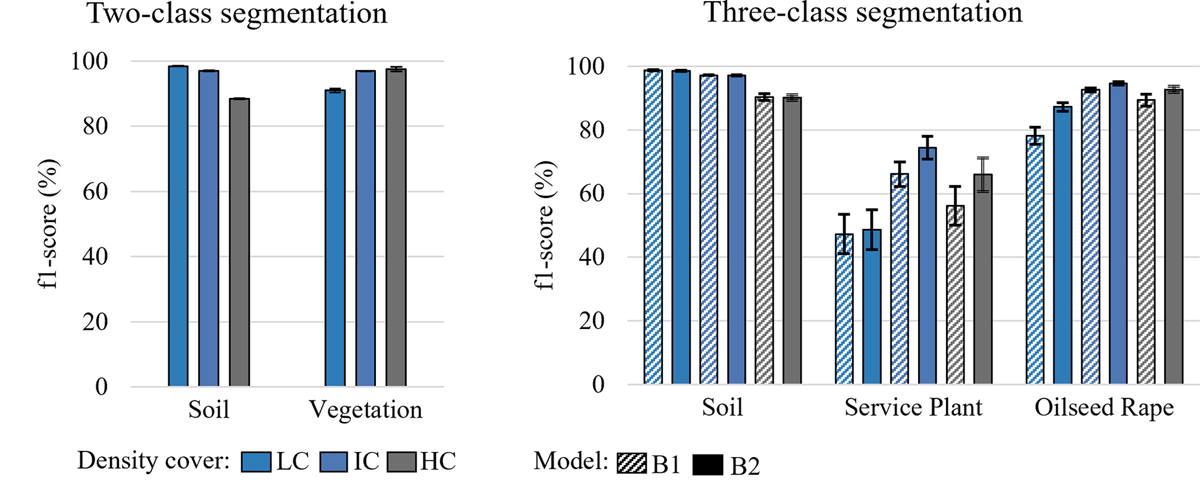
Fig. 7
Download original image
Comparison of the model’s f1-score over three canopy coverage levels. The two-class (left) and three-class (right) segmentation models. Canopy covers mean f1-scores of the N images (Tab. 1). Error bars represent the standard deviation. LC: low cover, IC: intermediate cover and HC: high cover.
Current usage metrics show cumulative count of Article Views (full-text article views including HTML views, PDF and ePub downloads, according to the available data) and Abstracts Views on Vision4Press platform.
Data correspond to usage on the plateform after 2015. The current usage metrics is available 48-96 hours after online publication and is updated daily on week days.
Initial download of the metrics may take a while.