")
")
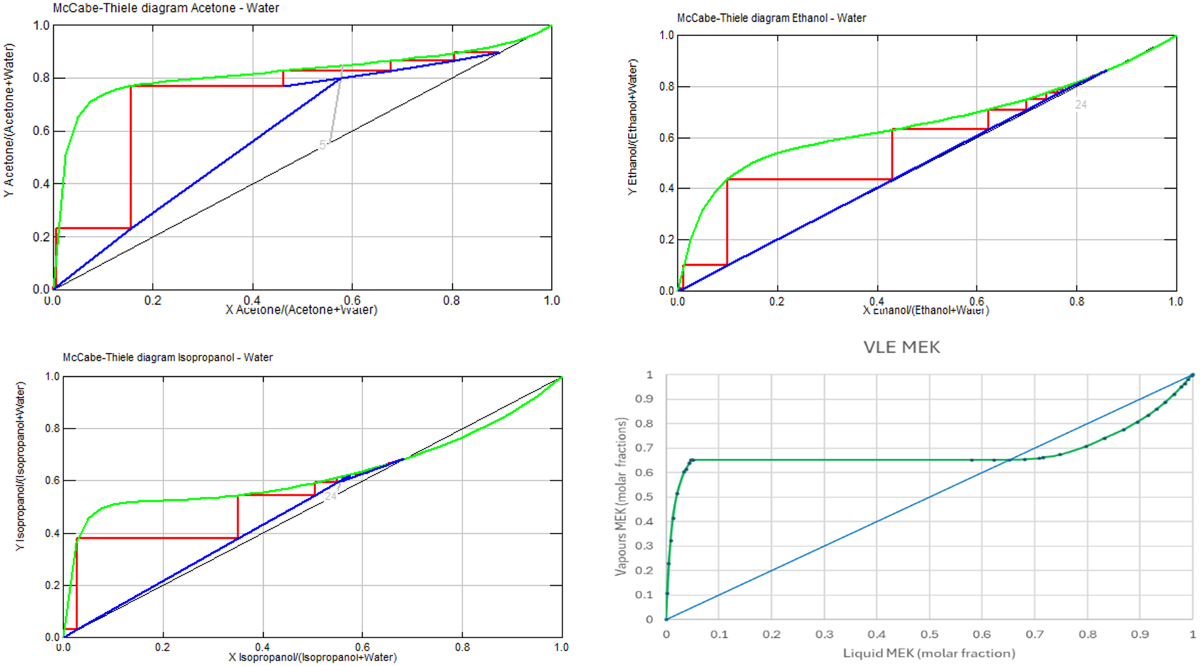
Fig. 2
Download original image
McCabe-Thiele diagrams for model distillation of acetone, ethanol, and isopropanol generated using ChemSep software. The simulations assume an initial water concentration of 20 mass% in each mixture. X axis represents the molar concentration of the solvent in the liquid phase, Y, the molar concentration of the solvent in the vapours phase. The vapour/liquid equilibrium diagram of MEK corresponds to experimental data obtained by Cho et al. (1983).
Current usage metrics show cumulative count of Article Views (full-text article views including HTML views, PDF and ePub downloads, according to the available data) and Abstracts Views on Vision4Press platform.
Data correspond to usage on the plateform after 2015. The current usage metrics is available 48-96 hours after online publication and is updated daily on week days.
Initial download of the metrics may take a while.