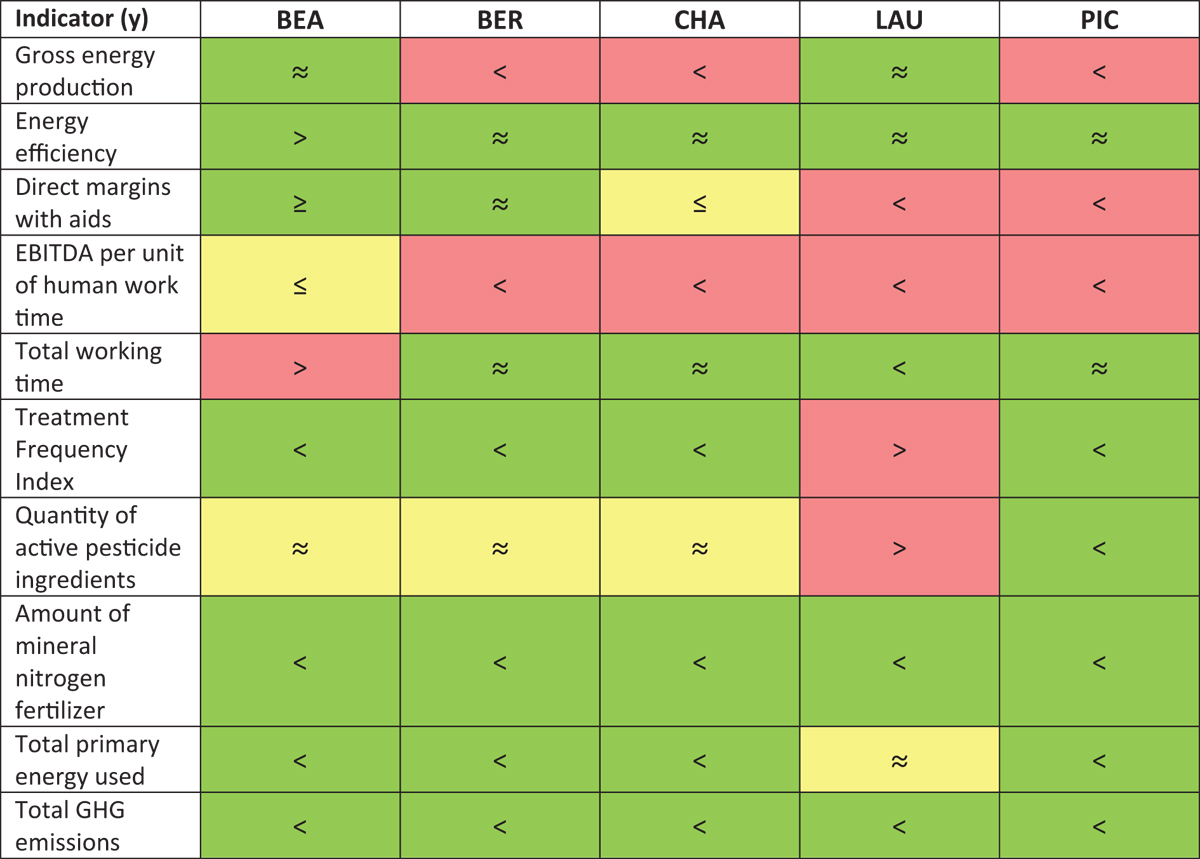
Table 10
Qualitative assessment of the performance gap trend of the innovative cropping system compared to the control system for each of the five experimental platforms. The symbols mean that the results of the innovative system are inferior (<), inferior or equal (≤), equivalent (≈), superior or equal (≥) or superior (>) to the control system. The color code refers to the level of satisfaction, which refers to the absence of deterioration in economic performance, productivity and working time, and to the improvement in environmental performance and input use. Green means satisfied, red dissatisfied, yellow partially satisfied. BEA: Béarn, BER: Berry, CHA: Champagne; LAU: Lauragais, PIC: Picardie).

Current usage metrics show cumulative count of Article Views (full-text article views including HTML views, PDF and ePub downloads, according to the available data) and Abstracts Views on Vision4Press platform.
Data correspond to usage on the plateform after 2015. The current usage metrics is available 48-96 hours after online publication and is updated daily on week days.
Initial download of the metrics may take a while.


