")
")
| Issue |
OCL
Volume 33, 2026
Palm and palm oil / Palmier et huile de palme
|
|
|---|---|---|
| Article Number | 10 | |
| Number of page(s) | 14 | |
| DOI | https://doi.org/10.1051/ocl/2026001 | |
| Published online | 04 March 2026 | |
Research article
Labour demand, economic profitability, energy efficiency, and greenhouse gas emissions: A comparative assessment of mechanization scenarios across yield gradients in oil palm crops in Colombia☆
Besoins en main d’œuvre, rentabilité économique, efficacité énergétique et émissions de gaz à effet de serre : Comparaison de scénarios de mécanisation en fonction des rendements chez le palmier à huile en Colombie
1
Research Results Validation Unit, Oil Palm Research Center (Corporación Centro de Investigación en Palma de Aceite - Cenipalma), Paratebueno, Cundinamarca, Colombia
2
Agronomy Program, Cenipalma, Oil Palm Research Center (Corporación Centro de Investigación en Palma de Aceite - Cenipalma), Paratebueno, Cundinamarca, Colombia
3
General Managment, Cenipalma, Oil Palm Research Center (Corporación Centro de Investigación en Palma de Aceite - Cenipalma)
4
Processing Program - Biorefinery and Sustainability Area, Oil Palm Research Center (Corporación Centro de Investigación en Palma de Aceite - Cenipalma), Paratebueno, Cundinamarca, Colombia
* Corresponding author: This email address is being protected from spambots. You need JavaScript enabled to view it.
Received:
6
September
2025
Accepted:
16
January
2026
Abstract
Sustainable intensification of perennial oil palm production systems requires balancing energy efficiency, economic profitability, greenhouse gas emission, and labour requirements. This study evaluated three mechanization scenarios (manual, semi-mechanized with standard capacity equipment’s and semi-mechanized with high-capacity equipment’s) across five yield levels (15–35 t FFB ha−1 yr−1; FFB = Fresh Fruit Bunches), based on data from 26 plantations in the Colombian Orinoquia Natural Region. Methodologies included energy analysis, economic evaluation, life cycle assessment of Greenhouse Gas emissions (GHG), and labour demand quantification. Results demonstrate that yield intensification constitutes the primary driver of systemic efficiency, with energy ratios improving from 2.10 to 2.42 and emissions decreasing from 84.8 to 66.3 kg CO2 t⁻1 FFB. Semi - mechanized systems contribute directly to intensification by enabling precise input applications and timely execution of agronomic practices, particularly in fertilization and harvesting. Semi-mechanized systes with high capacity equipment’s reduces labour demand by 26–46% compared to manual systems and facilitates scalable operations. It also emerges as the most profitable scenario, with economic viability achieved from 15 t FFB ha⁻1 yr⁻1.
Résumé
L’intensification durable des systèmes de production d’huile de palme demande d’atteindre un équilibre entre l’efficacité énergétique, la rentabilité économique, les émissions de gaz à effet de serre et les besoins en main d’œuvre. Trois scénarios de mécanisation (manuel, semi-mécanisé avec des équipements de capacité standard et semi-mécanisé avec des équipements de grande capacité) pour cinq niveaux de rendement différents (15–35 t de régimes de fruits frais (RFF) ha⁻¹ an⁻¹) ont été évalués dans la région de l’Orénoque, en Colombie, en utilisant les données issues de 26 plantations différentes.
Les méthodologies étudiées ici reposent sur une analyse énergétique, une évaluation économique, une analyse du cycle de vie des émissions de gaz à effet de serre (GES) et une quantification de la demande en travail. Les résultats montrent que l’intensification des rendements est le principal moteur de l’efficacité du système, avec des ratios énergétiques qui passent de 2,10 à 2,42 et des niveaux d’émissions qui diminuent de 84,8 à 66,3 kg CO2 t⁻¹ de RFF.
Les systèmes semi-mécanisés contribuent directement à l’intensification, en permettant un épandage précis des intrants et une exécution opportune des travaux agricoles, notamment des fumures et de la récolte des régimes. Les systèmes semi-mécanisés, qui font appel à du matériel plus performant, permettent de réduire la demande en main-d’œuvre de 26 à 46% par rapport aux systèmes manuels et facilitent les opérations à grande échelle. Ils présentent également le scénario le plus rentable, avec une viabilité économique atteinte dès 15 t de RFF ha⁻¹ an⁻¹.
Key words: mechanization / energy efficiency / greenhouse gas emissions / labour productivity / oil palm
Mots clés : mécanisation / efficacité énergétique / émissions de gaz à effet de serre / productivité du travail / palmier à huile
Contribution to the Topical Issue: “Palm and palm oil / Palmier et huile de palme”.
© E. Ruiz-Alvarez et al., Published by EDP Sciences, 2026
 This is an Open Access article distributed under the terms of the Creative Commons Attribution License (https://creativecommons.org/licenses/by/4.0), which permits unrestricted use, distribution, and reproduction in any medium, provided the original work is properly cited.
Highlights
Semi-mechanized systems doubles worker efficiency (14-19 vs 7-12 ha worker−1) and increases profitability (IRR 14.1% vs 11.2%) compared to manual mechanization.
Yield intensification, enabled by mechanization, drives energy efficiency (15% improvement) and emission reductions (22% per t FFB) in oil palm systems.
1 Introduction
Oil palm (Elaeis guineensis Jacq.) represents the world's most productive oilseed crop. In 2023 yields were estimated at approximately in 3.65 t of oil per hectare compared to 0.43 t for soybean and 0.78 t for rapeseed (Fedepalma, 2025). Global oil palm production has increased from 77.2 million tonnes in 2019 to over 81.6 million tonnes in 2020, with Indonesia and Malaysia accounting for 82% of world production (Fedepalma, 2025). In this competitive contexts, emerging producers like Colombia (responsible for 2.3% of global oil palm production) face significant challenges in achieving cost competitiveness while maintaining environmental sustainability standards (Purnama et al., 2025).
Historically, Colombian oil palm agroindustry has relied on human labour, manual tools, and draft animals for agricultural operations (Cock et al., 2022). Labour costs alone represent approximately 40% of total production costs per ton of Fresh Fruit Bunches (FFB) (Ruíz et al., 2022), making operational efficiency a critical concern. Moreover, the increasing scarcity of rural labour (Dedieu et al., 2022) suggest the urgency of exploring technological alternatives that enhance productivity while improving working conditions (Azarias et al., 2020; Dedieu, Nettle, et al., 2022; Dockès et al., 2018; Santhanam-Martin et al., 2024).
In Colombia, mechanization adoption has demonstrated substantial improvements in labour productivity. Recent studies document that mechanized harvesting systems enhance labour productivity by 15%–30% compared to manual methods (Mosquera-Montoya et al., 2023; Ruiz et al., 2020; A. Zapata-Hernández et al., 2024). In Malaysia, studies suggest that mechanized technologies adoption can improve operational efficiency in oil palm crops, reducing labour requirements from one worker per 10 hectares to one per 15 hectares (Norhajijah et al., 2021). Furthermore, the adoption of these technologies improves working conditions and contributes to attracting young workers to the sector (Hamzah and Hashim, 2024; Malanski et al., 2022; Nettle et al., 2018; Syarifudin and Zareen, 2021).
Although the impact of mechanization on labour productivity has been widely documented, critical knowledge gaps persist regarding its integrated effects across varying yields scenarios, particularly its interactions with energy use and environmental performance. The transition toward mechanized systems entails substantial shifts in energy flows and associated emissions (FAO, 2022). As energy consumption from human labour and draft animals declines, fossil fuel use tends to increase (Baruah and Bora, 2008; Peng et al., 2022), raising concerns about overall energy efficiency and greenhouse gas emissions (GHG) (Aguilera et al., 2019; Jia and Xu, 2024). This intersection between labour management and technology adoption requires integrated analyses that simultaneously evaluate economic, environmental and social dimensions (Kumar et al., 2022).
Specialized literature indicates that energy efficiency in agrifood systems depends on multiple variables: crop type, energy sources, climatic conditions, geographical location, and technological level (Kargwal et al., 2022). Although studies exist on energy consumption patteñrns in annual crops such as wheat, cotton, and corn (Hormozi et al., 2012; Mandal et al., 2002; Unakitan et al., 2010), information on perennial crops like oil palm remains scarce. Even more limited is research that examines energy implications of different mechanization alternatives within this sector (Azwan et al., 2016; Hormozi et al., 2012).
The productive structure of Colombian oil palm, organized in clusters of extraction companies that process FFB and palm producers who supply the fruit, creates an ideal scenario for evaluating different levels of mechanization (Zapata-Hernández et al., 2024). In this context, the present study examines the interaction between three mechanization scenarios (manual, semi-mechanized with standard capacity equipment’s and semi-mechanized with high-capacity equipment’s) and five crop yield levels (15, 20, 25, 30, 35 t FFB ha−1 yr−1). This analysis focuses on four key dimensions: labour demand, energy efficiency, CO2 emissions, and economic profitability.
The selection of these four dimensions aligns with contemporary guidance on sustainable agricultural mechanization, which couples economic and social outcomes with environmental performance. The FAO framework explicitly positions mechanization as environmentally compatible and climate-smart, thereby requiring metrics on energy use and greenhouse-gas emissions alongside labour and cost profit indicators (Chaitrali et al, 2025; FAO, 2019).
In Colombia’s oil palm farms, high labour demand especially in harvesting remains a binding constraint to productivity, making mechanization a necessary lever to relieve bottlenecks. At the same time, technology acquisition must align with the sector’s clean sustainability commitments (Ramirez-Contreras et al., 2020), prioritizing options that raise energy use efficiency and reduce CO2 while preserving profitability.
Recognizing that mechanization effects are not uniform across yield gradients, the analysis incorporates responses to operational intensity, input requirements, and logistical conditions. Moreover, by integrating labour, energy, environmental, and economic indicators, the study offers a multidimensional framework for decision makers. This combined approach not only addresses critical gaps in understanding the balance between mechanization benefits and associated costs but also supports recommendations for sustainable intensification across heterogeneous production settings.
2 Methodology
2.1 Study population and sampling
The data used to develop the three mechanization scenarios evaluated were derived from a previous study by the authors on technology adoption conducted in five municipalities in the Colombian Orinoquía Natural Region (Zapata-Hernández et al., 2024). The study population comprised 63 oil palm plantations, including Elaeis guineensis Jacq. and interspecific hybrids (Elaeis guineensis Jacq × Elaeis oleífera). These plantations covered a total area of 35,583 hectares and included both medium scale (50–500 ha) and large-scale (>500 ha) producers (13% of Oil palm crops in Colombian Orinoquia Region). All plantations had mature crops in the productive stage, ranging from 7 to 17 yr after planting, with FFB yields between 15 and 35 t ha−1 yr−1.A stratified sampling was performed, using oil palm clusters as a stratification criterion, with a 95% confidence level and a 15% sampling error, resulting in a final sample of 23 plantations (20.119 ha). While the 15% error margin is considerable, this level of precision is methodologically appropriate for exploratory research aimed at identifying representative regional trends in agricultural mechanization systems.
2.2 Data collection and analysis
A semi-structured questionnaire was designed and administrated through interviews with plantations administrators and technical assistants from 26 selected plantations. The data collection instrument was primarily oriented to characterize mechanization adoption across the primary agronomic management processes in oil palm crops: harvesting, fertilization, weed management, infrastructure maintenance, phytosanitary spraying, pruning, irrigation, and FFB transport to the processing plant. For each process, necessary aspects for conducting the proposed analyses were documented: machinery type, use frequency, operational performance (measured in hectares per day or tons of FFB per day), initial capital investment (CAPEX), maintenance costs, fuel consumption, labour requirements and salary levels, among other relevant variables.
2.3 Methodological basis for mechanization scenario classification
The three mechanization scenarios evaluated in this study were established through empirical analysis of technology adoption patterns documented in previous studies (Mosquera-Montoya et al., 2023; Zapata-Hernández et al., 2024). The classification integrated two operational criteria: adoption frequency (percentage of plantations using specific technologies) and operational performance (field capacity measured as ha day⁻¹ or t FFB day⁻¹) (Zapata-Hernández et al., 2024).
Scenario 1 (S1) – Manual and animal powered systems: Historical baseline of Colombian oil palm production, where buffaloes and manual tools are the main power sources for field operations (Mosquera-Montoya et al, 2023). This scenario represents 22% of the plantations surveyed.
Scenario 2 (S2) – Semi-mechanized systems: standard capacity equipment’s: Was defined as the emerging regional standard. This scenario comprises plantations that employ tractors for most field operations and utilize equipment with low effective field capacity; consequently, despite the presence of mechanization, tasks remain predominantly labor-intensive. This scenario accounts for 70% of the plantations surveyed.
Scenario 3 (S3) – semi-mechanized systems: High capacity equipment’s: incorporates equipment demonstrating the highest operational performance documented in the region, reflecting the achievable technological frontier for Colombian oil palm systems (Zapata-Hernández et al., 2024). Nevertheless, the scenario retains a critical dependence on manual labor for fresh-fruit-bunch (FFB) cutting, and accounts for 9% of the surveyed plantations.
Table 1 synthesizes the mechanization technologies options employed across three scenarios, specifying equipment types and their corresponding operational performance metrics for each primary production process. For processes conducted primarily through manual labour, such as phytosanitary monitoring, pruning, and surface irrigation, parameters were assumed to be identical across all three scenarios. This is because the mechanization level evaluated does not introduce notable variations in their execution.
This approach enabled comparative analyses across different crop yield levels (15, 20, 25, 30, and 35 t FFB ha−1 yr−1). This approach allows for the assessment not only of the impact of technological level, but also of the interaction between mechanization and yield.
Mechanization of technology options across scenarios (adapted from Zapata-Hernández et al., 2024).
2.4 Assessment indicators
For the evaluation of the mechanization systems, a set of indicators was developed encompassing four dimensions: energy efficiency, environmental sustainability, labour requirement, and economic profitability.
Labour requirement: Under each mechanization scenario, labour requirements were quantified using productivity indicators derived from the frecuency of maintenance operations in mature plantations and operational performance achieved in each process according to technological alternatives (Tab. 1). The labour requirement per unit area was calculated as the ratio between total workdays performed in oil palm operations over a year and the planted area, as expressed in equation (1) (Ruiz et al., 2022).
 (1)
(1)
Where L represents the labour requirement (workdays ha−1 yr−1), W denotes the total number of workdays performed in oil palm operations over a year (one workday = 8 h), and A is the planted area (ha).
To account for variations in crop productivity, the labour requirement was also expressed per unit of production. This indicator was calculated by normalizing the area-based requirement by the annual yield according to equation (2):
 (2)
(2)
where LFFB represents the labour requirement per tonne of FFB (Y) (workdays t−1 FFB). A complementary indicator of labour efficiency was calculated to assess the operational capacity of individual workers. The area per worker (APW) represents the cultivated area that one worker can sustainably manage in a year under specific mechanization and productivity conditions. This indicator was calculated as the ratio between the legal annual workdays per worker (Dw) and the labour requirement per hectare (L), as expressed in equation (3):
 (3)
(3)
Energy efficiency: The energy performance of each mechanization scenario was evaluated through a comprehensive input-output analysis following established methodologies for agricultural energy assessments (Elsoragaby et al., 2019; Hercher-Pasteur et al., 2020; Kargwal et al., 2022). Output energy was determined from the FFB energy content, set at 8 MJ kg−1, excluding residual biomass from oil extraction (Azwan et al., 2016). Input energy encompassed both direct and embodied energy from all production factors: human labour, fossil fuels, machinery, draft animal traction, agrochemicals (fertilizers, herbicides, and fungicides), and irrigation water. Energy equivalence coefficients were obtained from validated sources in the literature (Azwan et al., 2016; Cherati et al., 2011; Mousavi-Avval et al., 2012; Pishgar-Komleh et al., 2012; Sharafi et al., 2023; Unakitan et al., 2010). All energy flows were computed on an annual basis and expressed in megajoules (MJ).
The energy ratio (ER) quantifies the overall energy conversion efficiency of the production system, calculated as the ratio between output and input energy according to equation (4):
 (4)
(4)
where Eout represents the total energy content of FFB produced (MJ ha−1 yr−1) and Ein denotes the total input energy from all sources (MJ ha−1 yr−1). An energy ratio greater than 1.0 indicates that the system produces more energy than it consumes.
Energy productivity (EP) expresses the production efficiency per unit of energy invested, calculated according to equation (5):
 (5)
(5)
Where Y represents the annual FFB yield (kg FFB ha−1 yr−1). This indicator quantifies the kilograms of FFB produced per megajoule of input energy (kg FFB MJ−1).
Specific energy (SE), the inverse of energy productivity, indicates the input energy required per unit of production (MJ kg−1 FFB), as expressed in equation (6):
 (6)
(6)
Net energy (NE) represents the absolute energy surplus or deficit generated by the system on a per-hectare basis, calculated according to equation (7):
 (7)
(7)
where net energy is expressed in MJ ha−1 yr−1. This indicator reveals the actual energy contribution of the system, with positive values indicating net energy production and negative values indicating energy dependence.
Greenhouse gas emissions: Greenhouse gas (GHG) emissions were estimated through a life cycle assessment (LCA) following ISO 14044 (LCA) and ISO 14067 (product carbon footprint) standards, complemented by IPCC 2019 Refinement guidelines (Munar et al., 2021; Ramírez et al., 2024). The assessment utilized the APP Ecopalma calculator, a tool developed by Cenipalma specifically for quantifying GHG emissions from the crude palm oil production chain. The system boundary encompassed mature oil palm plantations, including all specified maintenance operations and both direct and indirect emissions related to fossil fuel use, fertilizers, agrochemicals (herbicides and fungicides), and field-level nitrogen transformations, while excluding land use change impacts.
The emission sources varied according to mechanization level. In the basic mechanization scenario (S1), characterized by high reliance on draft animals (buffalo), the assessment incorporated methane (CH4) emissions from enteric fermentation and manure deposition, as well as direct and indirect nitrous oxide (N2O) emissions from manure management, estimated according to IPCC guidelines. In semi - mechanized scenarios (S2 and S3), emissions shifted primarily toward fossil fuel combustion and fertilizer-related N2O, reflecting the technological transition from animal to mechanical power.
Total GHG emissions per hectare were calculated by aggregating contributions from all emission sources, with non-CO2 gases converted to CO2 equivalents using their respective global warming potentials (GWPs), as expressed in equation (8).
 (8)
(8)
where GHG represents annual emissions per hectare (kg CO2eq ha−1 yr −1); F is fuel consumption (L ha−1yr−1) and EFfuel its emission factor (kg CO2eq L−1); Fert denotes fertilizer use (kg nutrient ha−1 yr−1) and EFfert its emission factor (kg CO2 eq kg−1 nutrient); H represents herbicide and fungicide use (kg ha−1 yr−1) and EFh its emission factor (kg CO2 eq kg−1); CH4 and N2O are methane and nitrous oxide emissions (kg ha−1 yr−1) from enteric fermentation, manure management, and nitrogen fertilizer transformations; and GWPCH4 and GWPN2O are the corresponding global warming potentials (kg CO2eq kg−1).
To enable comparison across productivity levels, emission intensity was calculated by normalizing total emissions by annual yield according to equation (9):
 (9)
(9)
where GHGFFB represents the carbon footprint per unit of production (kg CO2eq t−1 FFB) and Y is the annual FFB yield (t FFB ha−1 yr−1). This indicator provides a measure of emission efficiency that accounts for productivity differences among scenarios.
Economic profitability: The economic assessment followed methodological guidelines from previous studies on the Colombian oil palm agroindustry (Mosquera-Montoya et al., 2023) as well as other methodological approaches for assessing agricultural mechanization profitability (Guei et al., 2025; Hasan et al., 2021; Muratova and Ivanova, 2023). Costs were calculated for each of the three mechanization scenarios under five yield levels, including direct expenses for labour, machinery use, draft animals, and inputs in the evaluated production processes. Labour costs were based on the regional average daily wage (USD 29 workday−1), while machinery and draft animal costs included initial investment, financing (16% effective annual rate over 7 yr), administration, and maintenance. All values were expressed in USD using the 2024 average market exchange rate (4,072 COP/USD).
The unit cost (UC) represents the average production cost per tonne of FFB in the mature stage. Total cost (TC) was calculated as the annual sum of operational costs (OC), management costs (Admin), and land cost (Land) (Gebiso et al., 2024; Guei et al., 2025; Mosquera-Montoya, M et al., 2023; Yan et al., 2024), as expressed in equation (10):
 (10)
(10)
where all cost components are expressed in USD ha−1 yr−1. The unit cost was then obtained by normalizing total cost by annual yield according to equation (11):
 (11)
(11)
Gross income (GI) was calculated as the product of annual yield and FFB price (Havugimana et al., 2025), using the average price over 4 yr (USD 160 t−1 FFB), as shown in equation (12):
 (12)
(12)
where P represents the FFB price (USD t−1 FFB). Net income (NI) represents the annual net earnings per hectare after deducting all costs associated with production and financing, calculated according to equation (13)
 (13)
(13)
where I denote the annual financing interest linked to capital expenditure (USD ha⁻¹ yr⁻¹), and D represents machinery depreciation (USD ha⁻¹ yr⁻¹). This indicator provides a direct measure of annual profitability under each mechanization scenario and yield level.
The benefit-cost ratio (BCR) quantifies the economic return per unit of investment (Hasan et al., 2021), calculated as the quotient for gross income and total cost according to equation (14).
 (14)
(14)
where values greater than 1.0 indicate that revenues exceed costs, demonstrating economic viability.
To assess long-term profitability, net present value (NPV) was calculated by discounting annual cash flows (Hasan et al., 2021; Muratova and Ivanova, 2023) over the 25 yr project lifetime according to equation (15):
 (15)
(15)
where CFt represents the cash flow in year t (USD ha⁻¹), k is the discount rate (8%), n is the project lifetime (25 yr), and I0 denotes the initial investment per hectare (USD ha⁻¹). Positive NPV values indicate profitability in present-value terms, supporting long-term economic feasibility.
The internal rate of return (IRR) represents the discount rate at which NPV equals zero (Hasan et al., 2021; Muratova and Ivanova, 2023), indicating the break-even point for the project. This was determined by solving equation (16):
 (16)
(16)
where the IRR value, expressed as a percentage, indicates the project's inherent rate of return independent of external discount rates.
Finally, the payback period (PBP) quantifies the time required to recover the initial investment from cumulative cash flows (Hasan et al., 2021; Muratova and Ivanova, 2023), calculated according to equation (17):
 (17)
(17)
where n represents the last complete year before investment recovery, ∑CF is the cumulative sum of cash flows up to year n, and CF(n+1) corresponds to the cash flow of the following year. This indicator, expressed in years, provides a measure of investment risk and capital recovery speed.
3 Results and discussion
3.1 Labour requirements
Labour shortages in the Colombian oil palm sector, driven by demographic and economic factors, have positioned mechanization as a viable strategy to reduce physical effort and improve labour productivity (Ahmad et al., 2021). Although mechanization has sustained production in these crops, its impact on labour demand under different productivity scenarios had not been comprehensively quantified. As shown in Figures 1a and 1b, our results reveal significant differences in labour requirements among the evaluated scenarios. The Manual and animal powered systems (S1) require 24–42 workdays ha−1 yr−1 (1.1–1.6 workdays t−1 FFB), whereas semi-mechanized systems - standard capacity equipment’s (S2) reduce these values to 19–31 workdays ha−1 yr−1 (0.9–1.3 workdays t−1 FFB). Semi-mechanized systems - High-capacity equipment (S3) show the lowest demand, with 15–22 workdays ha−1 yr−1 (0.6–1.0 workdays t−1 FFB). This progression represents a 15–46% reduction compared with S1, confirming the potential of high efficiency mechanization technologies to optimize labour use in oil palm cultivation (Mosquera-Montoya et al., 2023; Ruiz et al., 2020; Zapata-Hernández et al., 2024)
In the evaluated scenarios, labour savings from S3 increased progressively with crop productivity. At lower yields, operational volume was insufficient to fully exploit mechanized equipment capacity, resulting in only moderate labour reductions compared with manual systems (S1). A critical threshold emerged at 25 t FFB ha−1 yr−1, beyond which the advantage high-capacity equipment’s (S3) became more pronounced. This pattern reflects the relationship between yield and labour productivity in oil palm, where higher yields per se increase harvesting efficiency by reducing time lost in displacement while increasing time used to cutting and collection of bunches (Cock et al., 2022).
Below this threshold, labour savings from S3 ranged between 15–20% relative to S1. However, above 25 t FFB/ha/yr, high-capacity equipment’s reached peak efficiency gains, achieving a 46% reduction in labour requirements compared with manual and animal powered systems. This threshold thus reflects the interaction between mechanization capacity and crop productivity, with higher yields enabling operation closer to the optimal capacity of the machinery.
Harvesting accounts for between 38% and 49% of the total labour demand in mature Elaeis guineensis plantations, making it the most labor-intensive activity. The implementation of grabber systems in S3 significantly optimizes this resource compared with the traditional use of animal traction in S1. However, the effectiveness of these systems critically depends on adequate logistics, including the strategic location of collection centers (Bojacá et al., 2025), efficient transport route design, appropriate harvesting workforce arrangement, coordinated labour planning (Mosquera-Montoya et al., 2023), as well as the development of human capital and infrastructure with a mechanization-oriented approach (McDonald et al., 2024).
The indicator of hectares per worker further illustrates the efficiency in the use of available human resources. S3 demonstrates the highest efficiency, enabling a single worker to manage between 14 and 19 ha depending on crop yields. In contrast, S1 shows the lowest efficiency, with ranges between 7 and 12 ha per worker.
Although these findings are consistent with international reports documenting labour reductions following the adoption of technology in perennial crops, the magnitudes observed here are moderate compared with other production systems. A 33% decrease in labour demand was observed in Malaysian plantations following the adoption of mechanized equipment (Norhajijah et al., 2021), while in highly mechanized annual crops, reductions of up to 95% have been reported (Ibarrola-Rivas et al., 2016). This difference suggests that oil palm cultivation retains a substantial dependence on human labour, even under advanced mechanization schemes, reflecting the operational particularities inherent to perennial agricultural production systems.
 |
Fig. 1 (a) Workdays per hectare per year at different yield levels (FFB) and mechanization intensities; (b) Workdays per ton of FFB; (c) Area per worker (ha). |
3.2 Energy efficiency
From a complementary perspective, the energy efficiency analysis highlights that in perennial crops such as oil palm, energy is invested across multiple processes throughout the production cycle (25–30 yr), from establishment to the mature phase, including fertilization, pest and disease control, harvesting, and transportation. Each of these operations requires different amounts and forms of energy, and their efficiency varies significantly depending on the expected yield potential.
Across all scenarios, fertilizers constitute the dominant component of energy inputs (Fig. 2), ranging from 52,439 MJ ha⁻¹ yr⁻¹ (15 t FFB ha−1 yr−1) to 97,886 MJ ha−1 yr−1 (35 t FFB ha−1 yr−1), representing approximately 82–95% of total energy inputs. This pattern is consistent with Azwan et al. (2016), who reported fertilizers as accounting for 67% of total energy consumption in oil palm systems. Energy consumption associated with water use remains relatively constant across scenarios for similar yields, from 6,800 MJ ha−1 yr−1 at 25 t FFB ha−1 yr−1 to 13,600 MJ ha−1 yr−1 at 30–35 t FFB ha−1 yr−1. In Colombia’s Orinoquía region, annual rainfall exceeding 2,000 mm allows oil palm yields of up to 20 t FFB ha−1 yr−1 to be achieved without the need for irrigation.
The energy contribution of herbicides and pesticides remains constant across scenarios for equivalent productivity levels, increasing proportionally with production intensity (15–30 MJ ha−1 yr−1 for herbicides and 20–34 MJ ha−1 yr−1 for pesticides).
When assessing energy performance associated with the decision to adopt mechanization, three factors have a direct influence: the use of draft animals, human labour, and fuels. The energy associated with human labour follows a trend consistent with the results previously presented in terms of labour requirements. The highest human energy consumption occurs in Scenario 1 – manual systems, ranging from 367 to 614 MJ ha−1 yr−1, whereas the lowest values are found in Scenario 3 (238 to 316 MJ ha−1 yr−1), depending on crop productivity levels.
In parallel, the energy contribution from draft animals is eliminated in Scenario 2 (S2) and S3, while in S1 this value reaches up to 6,069 MJ ha−1 yr−1. In contrast, fuel energy consumption increases significantly in semi - mechanized scenarios (S2 y S3), though with notable differences between them. S2 shows the highest fuel consumption among the evaluated systems, ranging from 3,415 to 4,652 MJ ha−1 yr−1, attributed to lower field efficiencies that require longer operating times to complete equivalent tasks. For instance, fertilization operations in S2 using conventional broadcasters achieve ha worker−1day−1, while S3 employing variable rate fertilization technology reaches 29.3 ha worker−1day−1. This nearly 2.4-fold difference in operational capacity directly translates into proportionally higher fuel consumption per unit area in S2, despite this scenario utilizing higher horsepower tractors (75 HP versus 60 HP in S3 for comparable operations).
S3 presents intermediate fuel consumption values (2,531–3,591 MJ ha⁻¹ yr⁻¹), demonstrating that the incorporation of more efficient mechanization with higher field efficiencies allows for more rational fuel use. This result illustrates that technological operational efficiency exerts greater influence on fuel consumption than engine power alone, consistent with previous studies demonstrating that advanced agricultural technologies significantly improve the energy efficiency of production systems (Chowdhury et al., 2020; García Kerdan et al., 2020)
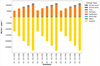 |
Fig. 2 Composition of energy inputs and outputs by scenario. |
3.2.1 Energy efficiency indicators
The calculated energy indicators (energy ratio, energy productivity, specific energy, and net energy) offer a comprehensive perspective on the energetic performance of each production system across different levels of intensification. These indicators show convergence among mechanization scenarios (Fig. 3), with no significant differences attributable to mechanization levels. This convergence results from the combination of two interrelated factors.
Energy ratio: The ER increased with crop productivity, ranging from 2.15 to 2.42 across the three scenarios evaluated (Fig. 3). When compared with previous studies in other oilseed crops, the values obtained are competitive and higher than those reported for oil palm in Malaysia (0.61) (Azwan et al., 2016), approaching those documented for soybean (3.1) and canola (2.9), and exceeding those for sunflower (2.17) and sesame (1.8) (Kargwal et al., 2022; Unakitan et al., 2010). The convergence of the three scenarios toward similar values at high yield levels (35 t FFB ha⁻¹ yr⁻¹) indicates that the system’s ability to maximize production per unit area becomes the determining factor for energy efficiency.
Energy productivity EP followed a trend like ER, increasing with crop yield and ranging from 0.26 to 0.30 kg FFB MJ−1 across all scenarios and yield levels. Scenario 1 (S1) and Scenario 3 (S3) showed nearly identical values, both higher than Scenario 2 (S2) at all evaluated productivity levels. The values obtained in all scenarios are substantially higher than the 0.08 kg FFB MJ−1 reported for mechanized oil palm in Malaysia (Azwan et al., 2016) and exceed those documented for other oilseed crops such as sunflower (0.08), soybean (0.11), canola (0.12), and rapeseed (0.22), being surpassed only by coconut (1.17) (Elsoragaby et al., 2019).
Specific energy SE, which quantifies the MJ required to produce one kilogram of FFB, decreased as productivity increased, from 3.80 MJ kg⁻¹ FFB at 15 t FFB ha−1 yr−1 to 3.30–3.33 MJ kg−1 FFB at 35 t FFB ha−1 yr−1. The values obtained are markedly lower than those reported for other oilseed crops such as sunflower (12.52), soybean (9.30), canola (8.27), rapeseed (4.89), and oil palm in Malaysia (12.9 MJ kg⁻¹) (Azwan et al., 2016; Elsoragaby et al., 2019; Kargwal et al., 2022). This highlights the high environmental value of oil palm production in Colombia.
Net energy NE showed a linear increase with yield in all three scenarios, rising from approximately 63,000 MJ ha−1 yr−1 at 15 t FFB ha−1 yr−1 to 165,000 MJ ha−1 yr−1 at 35 t FFB ha−1 yr−1.
The results of the energy analysis indicate that intensifying production is a viable strategy for enhancing the energy efficiency of oil palm systems. While mechanization modifies the composition of direct energy inputs, its overall contribution to total energy consumption remains relatively modest. Inputs directly associated with mechanization, such as labor, draft animals, fuel, and machinery, collectively account for less than 15% of the system’s total energy use. In contrast, chemical fertilizers and irrigation water dominate the energy balance (Fig. 2).
It is important to contextualize that even the most advanced mechanization scenario evaluated in this study (S3) represents a relatively early stage of technological development within the oil palm sector. The industry continues to operate within the paradigm of the second industrial revolution, relying on tools such as mechanized cutters and hydraulic arms for harvest operations (e.g., grabbers) (Ahmad et al., 2021; Norhajijah et al., 2021).
This technological gap is attributable to several interrelated factors. First, the biological and agronomic characteristics of oil palm, including asynchronous bunch ripening, complex canopy architecture, and challenging topographies in many production areas, impose significant constraints on mechanization (Norhajijah et al., 2021). Second, the resource constraints faced by small and medium-sized enterprises involved in developing specialized equipment for oil palm crops have presented challenges for innovative investment, contributing to a relatively slower pace of technological advancement in the sector.
In contrast, other crops with mechanization indices exceeding 2.0 kW ha−1 have demonstrated that adopting modern equipment substantially improves energy efficiency (Jensen et al., 2025; Yan et al., 2024; Zhu et al., 2022). These findings suggest that achieving meaningful advances in oil palm mechanization requires both optimizing the logistics and operational efficiency of currently available technologies and pursuing transformative innovations that incorporate precision agriculture, robotics, and artificial intelligence to overcome current limitations and contribute to more sustainable energy use in the sector.
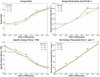 |
Fig. 3 Energy efficiency indicators (energy ratio, energy productivity, specific energy, and net energy) for Elaeis guineensis plantations under Scenario 1 (S1), Scenario 2 (S2) and Scenario 3 (S3). |
3.2.2 Greenhouse gas emissions
Figure 4 presents the GHG analysis, showing variations according to the level of mechanization and the yield achieved. Across the three scenarios evaluated, total emissions per hectare ranged from 1,250 to 2,300 kg CO2eq ha−1 yr−1, with progressive increases as productivity rose. This trend is attributed to the intensification of agricultural inputs and operations. Therefore, although high productivity per hectare can be efficient, the increased use of fertilizers and fuels results in a higher absolute emission per unit area. The composition of emissions indicates that chemical fertilizers are the dominant source in all scenarios, accounting for approximately 50–65% of the total, followed by emissions from nitrous oxide (N₂O), both direct and indirect, which together contribute 20–30% of total emissions.
Contributions from fuel use and emissions generated by draft animals vary according to the scenario. Scenario 1 (S1) is characterized by significant contributions from enteric emissions derived from working buffaloes, a fraction absents in mechanized systems, whereas Scenario 2 (S2) and Scenario 3 (S3) shows higher fossil fuel emissions proportional to the level of mechanization adopted.
S2 and S3 differ from S1 in that they concentrate higher emissions associated with fossil fuel use. S2 exhibits the highest fuel emissions, ranging from 191 kg CO2eq ha−1 yr−1 at 15 t FFB ha−1 yr−1 to 260 kg CO2eq ha−1 yr−1 at 35 t FFB ha−1 yr−1. S3 presents fuel-emissions ranging from 141 to 201 kg CO2eq ha−1 yr−1.
The lower fuel-related emissions observed in semi-mechanized systems - High capacity equipment’s, suggest that these technologies are more fuel efficient, not necessarily because they consume less fuel, but because they can do more with the same amount. In other words, their improved operational capacity allows them to cover larger areas or complete more tasks without increasing fuel use, which translates into better energy performance overall (Anyaoha and Zhang, 2021; Balafoutis et al., 2017).
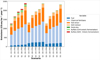 |
Fig. 4 Greenhouse gas emissions in Elaeis guineensis plantations under Scenario 1 (S1), Scenario 2 (S2) and Scenario 3 (S3). |
• Emission intensity per tonne of FFB
The analysis of emission sources per unit of product assessed in this study (kg CO2eq t⁻¹ FFB) reveals more favorable trends toward productive intensification. Figure 5 shows a consistent reduction in emissions as yield increases across all evaluated scenarios. In S1, specific emissions decrease from 84.8 kg CO2eq t⁻¹ FFB at 15 t FFB ha−1 yr−1 to 68.4 kg CO2eq t−1 FFB at 35 t FFB ha−1 yr−1. S2 presents values ranging from 88.3 to 68.0 kg CO2eq t−1 FFB, while S3 ranges from 85.0 to 66.3 kg CO2eq t−1 FFB.
These results indicate that, regardless of the mechanization level, increasing yield leads to lower emission intensity per ton of FFB, thereby reinforcing the role of productivity gains as a climate change mitigation pathway in oil palm production systems.
A consistent reduction in emission intensity (kg CO2eq t−1 FFB) is observed as productivity increases across all mechanization scenarios. A critical threshold is identified at 25 t FFB ha−1 yr−1, beyond which emissions per unit of product decrease more sharply in all cases. This reduction is particularly evident in the S3, which emerges as an effective alternative for emission mitigation in oil palm systems (García Kerdan et al., 2020).
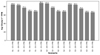 |
Fig. 5 CO2 emissions per tonne of FFB by scenario. |
3.3 Economic profitability
The production cost structure per hectare is presented in Figure 6. The results show that the S3 consistently maintains the lowest total costs across all evaluated yield levels, ranging from USD 1,528 ha−1 yr−1 at 15 t FFB ha−1 yr−1 to USD 2,800 ha−1 yr−1 at 35 t FFB ha⁻¹ yr⁻¹. The semi – mechanized systems with standard capacity equipment’s (S2) presents intermediate costs, while the manual scenario (S1) records the highest costs, reaching up to USD 3,397 ha−1 yr−1 at the highest productivity level.
In the manual scenario (S1), labour costs account for a large proportion of the operating budget, particularly evident at productivity levels of 30 and 35 t FFB ha−1 yr−1, where they exceed USD 1,000 ha−1 yr−1. This high dependence on manual labour increases vulnerability to wage fluctuations and labour shortages, a phenomenon widely documented in the Colombian oil palm agroindustry (Mosquera-Montoya et al., 2023). In contrast, the semi-mechanized scenarios (S2 and S3) show a substantial reduction in labour costs (Liu and He, 2024; Narzullaev et al., 2023). In the case of Scenario 2, this reduction is estimated at 20–25%, whereas in Scenario 3 particularly in highly productive plantations it can reach up to 40%.
Table 2 presents economic indicators that can support decision makers regarding the adoption of mechanization systems. The Internal Rate of Return (IRR) shows that the scenario (S1) requires productivities above 25 t FFB ha⁻¹ to achieve financial viability. The S2 reaches an IRR of 13.1% at 35 t FFB ha−1 yr−1, whereas scenario 3 demonstrates greater economic robustness, with values ranging from 9% (15 t FFB ha−1 yr−1) to 14% at the highest productivity level.
The Net Present Value (NPV) reinforces the IRR findings. showing a progression that consistently favors scenario S3, particularly at high productivity levels. While scenarios S1 and S2 record negative NPV at 15 t FFB ha−1 yr−1 (–1.281 and –113. respectively), scenario S3 achieves an NPV of 464 at the same productivity level.
Similarly, unitary production costs (mature stage) reveal substantial economies of scale. with scenario S3 showing the most competitive values decreasing from USD 111 t⁻¹ FFB at low yield to USD 91 t⁻¹ FFB at high productivity representing a 30% reduction, which surpasses the improvements observed in scenarios S1 (16%) and S2 (27%).
S3 presents the most favorable benefit cost ratios. reaching 1.79 at 35 t FFB ha⁻¹, compared with 1.66 for S2 and 1.49 for S1 at the same yield level. Payback periods decreased progressively from 14.71 yr in S1 at low yield to 9.29 yr in S3 at high yield.
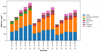 |
Fig. 6 Costs by scenario (USD ha⁻¹ yr⁻¹). |
Economic indicators (IRR, NPV, Total cost in mature stage (USD t⁻¹ FFB), Long-term total cost (USD t⁻¹ FFB), Net income (USD ha⁻¹), Benefit–cost ratio, and Payback period).
4 Conclusions
The results of this analysis reveal interactions between mechanization level, yield intensification and sustainability indicators in oil palm production systems. These findings provide essential insights for understanding technological transition pathways in perennial crops.
Productive intensification emerges as the primary determinant of systemic efficiency across the multiple dimensions evaluated, offering an alternative to reduce cultivated areas by maximizing the productivity of existing plantations (Dalheimer et al. 2022).
The energy analysis reveals that productive intensification emerges as the primary driver of energy efficiency improvements, with higher yield systems demonstrating more efficient conversion of energy inputs into useful biomass and optimized net energy balance.
The comparative assessment of mechanization systems reveals convergence in the main energy efficiency indicators (energy ratio, specific energy, energy productivity, and net energy), suggesting that mechanization level exerts limited influence on overall energy performance. This pattern is explained by the dominant contribution of chemical fertilizers and irrigation water, which account for 85–90% of total energy inputs, while human labour, machinery, and fossil fuels contribute less than 15%. However, mechanization plays a strategic enabling role that extends beyond its direct energy contribution. By facilitating timely fertilizer application and efficient execution of critical agronomic practices as harvesting, mechanization systems enable the intensive management practices necessary to achieve the higher yields that drive overall energy efficiency (Abbas et al. 2017).
Within this context, semi-mechanized systems emerges as the most energy-efficient strategy when examining mechanization-related inputs exclusively, as more advanced technologies optimize energy conversion through greater operational capacity despite increased fossil fuel consumption. These findings reinforce the critical need to implement mechanization alternatives with higher productive capacity to maximize energy sustainability in oil palm systems.
The analysis of GHG emissions associated with FFB production confirms that productive intensification is an effective strategy for GHG mitigation, with reductions from 84.8 kg CO2eq t−1 FFB in low yield systems to 66.3 kg CO2eq t−1 FFB in high yield systems a 22% decrease in carbon intensity.
The comparative evaluation of emissions associated exclusively with mechanization decisions shows that the S3: 140–188 kg CO2eq ha−1 outperforms the manual system S1: 139–276 kg CO2eq ha−1, which combines fossil fuels with biogenic emissions from buffalo. This evidence challenges conventional perceptions, demonstrating that superior operational efficiency can result in lower total emissions.
The present assessment quantified greenhouse gas emissions within system boundaries extending from field production operations to FFB delivery at the mill gate. Although mechanization related emission differences were modest at this stage, future research should extend the life cycle assessment to include downstream processing and waste management operations. Attention should be directed toward valorization pathways for empty fruit bunches, palm oil mill effluent, and fiber residues, as these post-extraction processes may reveal more substantial emission differentiation among mechanization scenarios while simultaneously identifying opportunities for circular economy integration within the oil palm value chain.
Persistent labour dependence, even under advanced mechanization, reflects the complex nature of oil palm as a perennial crop. Labour demand reductions of 26–46% observed in mechanized scenarios address critical workforce scarcity challenges in regions where rural labour availability has become increasingly limited. For workers who remain in the industry, mechanization represents a pathway toward improved working conditions by alleviating physical demands under challenging tropical climate conditions and facilitating operational tasks. Efficiency gains enabling workers to manage larger areas (from 7–12 ha per worker to 14–19 ha) translate into potential income improvements, as productivity-based compensation systems allow workers to achieve higher daily outputs.
However, realizing these benefits requires addressing the challenge of workforce development, as the transition to mechanized systems necessitates investment in training programs to build the technical skills required for equipment operation and maintenance. This human capital development represents a critical complementary investment to mechanization adoption, essential for ensuring that technological advances translate into tangible improvements in both operational efficiency and worker welfare.
On the other hand, the effectiveness of mechanized systems critically depends on enabling factors that go beyond the acquisition of equipment, including the implementation of appropriate logistics systems for equipment and product management, and the establishment of a robust support infrastructure comprising specialized after sales services, timely spare parts supply, and preventive and corrective maintenance programs. The absence or deficiency of any of these elements can significantly compromise operational performance and the economic viability of mechanization investments. regardless of the technical quality of the equipment adopted (Zapata et al., 2024).
High-capacity equipment’s (S3) demonstrate a substantial competitive advantage from an economic perspective, maintaining financial viability even under low yield scenarios (15 t FFB ha−1), compared with the minimum threshold of 20 t FFB ha⁻¹ required by manual systems and standard capacity equipment’s (S2). This economic superiority is grounded in the significant reduction in labour dependence, resulting in a more balanced cost structure that is less vulnerable to wage fluctuations in the context of labour scarcity characteristic of the Piedemonte region of the Colombian Orinoquía. These findings reveal a critical limitation in traditional decision processes for mechanization adoption in the oil palm sector, where evaluations predominantly focus on initial investment costs without fully considering the benefits derived from greater labour efficiency and improved capacity to execute planned agronomic operations on time.
The dominance of fertilizers in energy consumption patterns highlights opportunities for efficiency improvements through precision agriculture and optimized nutrient management. The potential integration of renewable energy into mechanized systems offers opportunities to address concerns over fossil fuel dependence, while future research should explore hybrid technologies that combine mechanization with renewable sources and precision agriculture systems.
From a sustainability perspective, the study provides evidence that well implemented mechanization can contribute to environmental objectives through reductions in emission intensity, despite increases in absolute fossil fuel consumption. The results have implications that extend beyond the Colombian oil palm sector, offering relevant insights for mechanization of perennial crops in tropical contexts facing similar challenges.
Acknowledgments
The authors thank the managers of the participating plantations from the Colombian Eastern Area, who allowed their technical staff to share the data and actively participate in this study. They also thank the Fondo de Fomento Palmero run by Fedepalma for funding this research.
References
- Abbas A, Yang M, Elahi E, Yousaf K, Ahmad R, Iqbal T. 2017. Quantification of mechanization index and its impact on crop productivity and socio-economic factors. Int Agric Eng J 26(3): 49–54. [Google Scholar]
- Aguilera E, Guzmán GI, González de Molina M, Soto D, Infante-Amate J. 2019. From animals to machines. The impact of mechanization on the carbon footprint of traction in Spanish agriculture: 1900–2014. J Clean Prod 221: 295–305. https://doi.org/10.1016/j.jclepro.2019.02.247 [Google Scholar]
- Ahmad SR, Mohd A, Mohd B, Ahmad MR. 2021. Enhancing mechanisation technology in oil palm plantation. Palm Oil Eng Bull No. 138. http://myagric.upm.edu.my/id/eprint/23450/ [Google Scholar]
- Anyaoha KE, Zhang L. 2021. Renewable energy for environmental protection: life cycle inventory of Nigeria’s palm oil production. Resour Conserv Recycl 174: 105797. https://doi.org/10.1016/j.resconrec.2021.105797 [Google Scholar]
- Azarias J, Nettle R, Williams J. 2020. National Agricultural Workforce Strategy: Learning to excel, National Agricultural Labour Advisory Committee. agriculture.gov.au/ag-farm-food/agricultural-workforce. [Google Scholar]
- Azwan MB, Norasikin AL, Abd Rahim S, Norman K, Salmah J. 2016. Analysis of energy utilisation in malaysian oil palm mechanisation operation. J Oil Palm Res 28(4): 485–495. https://doi.org/10.21894/jopr.2016.2804.10 [Google Scholar]
- Balafoutis A, Beck B, Fountas S, et al. 2017. Precision agriculture technologies positively contributing to GHG emissions mitigation, farm productivity and economics. Sustainability 9(8): 1339. https://doi.org/10.3390/su9081339 [CrossRef] [Google Scholar]
- Baruah DC, Bora GC. 2008. Energy demand forecast for mechanized agriculture in rural India. Energy Policy 36(7): 2628–2636. https://doi.org/10.1016/j.enpol.2008.03.030 [Google Scholar]
- Bojacá CR, Hernández-Rendón DA, Tupaz-Vera AA, Camperos-Reyes JE. 2025. Strategic optimization of harvest collection points in oil palm plantations☆. OCL 32: 24. https://doi.org/10.1051/ocl/2025025 [Google Scholar]
- Chaitrali SM, Tania S, Gayatri M, Arpita M, Ankita Sahu MM. 2025. Role of mechanization in sustainable agriculture: concepts, innovations, and way forward. Int J Res Agron. [Google Scholar]
- Cherati F, Bahrami H, Asakereh A. 2011. Energy survey of mechanized and traditional rice production system in Mazandaran Province of Iran. Afr J Agric Res 6. [Google Scholar]
- Chowdhury T, Chowdhury H, Ahmed A, et al. 2020. Energy, exergy, and sustainability analyses of the agricultural sector in Bangladesh. Sustainability (Switzerland) 12(11). https://doi.org/10.3390/su12114447 [Google Scholar]
- Cock J, Prager S, Meinke H, Echeverria R. 2022. Labour productivity: the forgotten yield gap. Agric Syst 201(July): 103452. https://doi.org/10.1016/j.agsy.2022.103452 [CrossRef] [Google Scholar]
- Dalheimer B, Kubitza C, Brümmer B. 2022. Technical efficiency and farmland expansion: evidence from oil palm smallholders in Indonesia. Am J Agric Econ 104(4): 1364–1387. https://doi.org/10.1111/ajae.12267 [Google Scholar]
- Dedieu B, Contzen S, Nettle R, Schiavi SM. de A, Sraïri MT. 2022. The multiple influences on the future of work in agriculture: global perspectives. Front Sustain Food Syst 6. https://doi.org/10.3389/fsufs.2022.889508 [Google Scholar]
- Dedieu B, Nettle R, Schiavi SM de A, Sraïri MT, Malanski PD. 2022. Which perspectives for work in agriculture? Food for thought for a research agenda. Front Sustain Food Syst 6. https://doi.org/10.3389/fsufs.2022.857887 [Google Scholar]
- Dockès A-C, Chauvat S, Correa P, Turlot A, Nettle R. 2018. Advice and advisory roles about work on farms. A review. Agron Sustain Dev 39(1): 2. https://doi.org/10.1007/s13593-018-0547-x [Google Scholar]
- Elsoragaby S, Yahya A, Mahadi MR, Nawi NM, Mairghany M. 2019. Energy utilization in major crop cultivation. Energy 173: 1285–1303. https://doi.org/10.1016/j.energy.2019.01.142 [Google Scholar]
- FAO. 2019. Sustainable agricultural mechanization: a framework for Africa - Synopsis. https://openknowledge.fao.org/server/api/core/bitstreams/c610a6b7-47fd-4b40-8cf7-e66dfd892735/content [Google Scholar]
- FAO. 2022. The State of Food and Agriculture 2022. Leveraging automation in agriculture for transforming agrifood systems. FAO. https://doi.org/10.4060/cb9479en [Google Scholar]
- Fedepalma. 2025. Anuario estadístico 2024. https://publicaciones.fedepalma.org/index.php/anuario/article/view/14372 [Google Scholar]
- García Kerdan I, Giarola S, Skinner E, Tuleu M, Hawkes A. 2020. Modelling future agricultural mechanisation of major crops in China: an assessment of energy demand, land use and emissions. Energies 13(24). https://doi.org/10.3390/en13246636 [Google Scholar]
- Gebiso T, Ketema M, Shumetie A, Feye GL. 2024. Impact of farm mechanization on crop productivity and economic efficiency in central and southern Oromia, Ethiopia. Front Sustain Food Syst 8. https://doi.org/10.3389/fsufs.2024.1414912 [Google Scholar]
- Guei MFM, Banakinaou W, Bakayoko M, Hasegawa H. 2025. Economic viability of mechanization service provision for rice cultivation: a case study of small and medium enterprises in Cote d’Ivoire. Sci Afr 29. https://doi.org/10.1016/j.sciaf.2025.e02848 [Google Scholar]
- Hamzah NH, Hashim MS. 2024. Impact of COVID-19 on labour usage and the production of oil palm yield. IOP Conf Ser: Earth Environ Sci 1397(1). https://doi.org/10.1088/1755-1315/1397/1/012001 [Google Scholar]
- Hasan MK, Tanaka TST, Ali MR, Saha CK, Alam MM. 2021. Harvester evaluation using real-time kinematic GNSS and hiring service model. Agri Eng 3(2): 363–382. https://doi.org/10.3390/agriengineering3020024 [Google Scholar]
- Havugimana A, Harerimana L, Gace D, Bugenimana D, Nsengimana A. 2025. Economic analysis and effect of using farm machinery for soybeans production at Gishari Demonstration Farm, Rwanda. Open J Appl Sci 15(06): 1766–1792. https://doi.org/10.4236/ojapps.2025.156121 [Google Scholar]
- Hercher-Pasteur J, Loiseau E, Sinfort C, Hélias A. 2020. Energetic assessment of the agricultural production system. A review. Agron Sustain Dev 40(4): 29. https://doi.org/10.1007/s13593-020-00627-2 [Google Scholar]
- Hormozi MA, Amin Asoodar M, Abdeshahi A. 2012. Impact of mechanization on technical efficiency: a case study of rice farmers in Iran. Proc Econ Financ 1: 176–185. https://doi.org/10.1016/S2212-5671(12)00021-4 [Google Scholar]
- Ibarrola-Rivas M, Kastner T, Nonhebel S. 2016. How much time does a farmer spend to produce my food? An international comparison of the impact of diets and mechanization. Resources 5(4): 47. https://doi.org/10.3390/resources5040047 [Google Scholar]
- Jensen TA, Antille DL, Tullberg JN. 2025. Improving on-farm energy use efficiency by optimizing machinery operations and management: a review. Agric Res 14(1): 15–33. https://doi.org/10.1007/s40003-024-00824-5 [Google Scholar]
- Jia Y, Xu H. 2024. Study of the relationship between agricultural mechanization, environmental regulation and agricultural carbon emissions; [农业机械化、环境规制与农业碳排放的关系研究]. J Chin Agric Mech 45(12): 208–215. https://doi.org/10.13733/j.jcam.issn.20955553.2024.12.031 [Google Scholar]
- Kargwal R, Yadvika Kumar A, Garg MK, Chanakaewsomboon I. 2022. A review on global energy use patterns in major crop production systems. Environ Sci: Adv 1(5): 662–679. https://doi.org/10.1039/D2VA00126H [Google Scholar]
- Kumar N, Chhokar RS, Tripathi SC, Gill SC, Kumar M. 2022. Frontier mechanization technologies for wheat based cropping systems BT - new horizons in wheat and barley research : crop protection and resource management. In: Kashyap PL, Gupta V, Prakash Gupta O, Sendhil R, Gopalareddy K, Jasrotia P, Singh GP, eds. Springer Nature Singapore, pp. 491–510. https://doi.org/10.1007/978-981-16-4134-3_18 [Google Scholar]
- Liu Q, He P. 2024. Research on the impact of agricultural machinery services on farmers’ enthusiasm of rapeseed planting in the Yangtze River Economic Zone: based on cost and yield perspective; [长江经济带农机服务对农户油菜籽种植积极性的影响研究 基 于 成 本 与 产 量 视 角]. J Chin Agric Mech 45(11): 290–298. https://doi.org/10.13733/j.jcam.issn.2095-5553.2024.11.045 [Google Scholar]
- Malanski PD, Schiavi SM de A, Dedieu B, Damansceno JC. 2022. International research on labor in agri-food value chains: a bibliometric review from web of science. Front Sustain Food Syst 6. https://doi.org/10.3389/fsufs.2022.852178 [Google Scholar]
- Mandal K., Saha K., Ghosh P., Hati K., Bandyopadhyay K. 2002. Bioenergy and economic analysis of soybean-based crop production systems in central India. Biomass Bioenergy 23(5): 337–345. https://doi.org/10.1016/S0961-9534(02)00058-2 [Google Scholar]
- McDonald N, Luke J, Cosby A. 2024. Non-technical skills needed for the current and next-generation agricultural workforce. Agriculture 14(7): 1106. https://doi.org/10.3390/agriculture14071106 [Google Scholar]
- Mosquera-Montoya M, Munévar Martínez DE, Ruíz Álvarez E, Fontanilla-Díaz CA, Salamanca ÓH, Obregón Esguerra JM. 2023. Labor productivity assessment of three different mechanized harvest systems in Colombian oil palm crops. OCL 30: 15. https://doi.org/10.1051/ocl/2023014 [CrossRef] [EDP Sciences] [Google Scholar]
- Mosquera-Montoya M, Ruiz-Álvarez E, Munévar-Martínez D, et al. 2023. Estudio de costos de producción 2022 para plantaciones de palma de aceite referentes por su productividad. Palmas 44(3): 43–55. https://publicaciones.fedepalma.org/index.php/palmas/article/view/14084/13930 [Google Scholar]
- Mosquera-Montoya M, Ruíz-Álvarez E, Munévar-Martínez D, Estupiñán M, Sinisterra K. 2023. Índice de costos para la palma de aceite (ICPA). Revista Palmas 44(3): 56–69. https://publicaciones.fedepalma.org/index.php/palmas/article/view/14085/ [Google Scholar]
- Mousavi-Avval SH, Mohammadi A, Rafiee S, Tabatabaeefar A. 2012. Assessing the technical efficiency of energy use in different barberry production systems. J Clean Prod 27: 126–132. https://doi.org/10.1016/j.jclepro.2012.01.014 [Google Scholar]
- Munar D, Chaparro D, Ramírez N, García J. 2021. Emisiones de gases de efecto invernadero para diferentes métodos de cosecha, alce y transporte de racimos de fruta fresca en palma de aceite. Revista Palmas 42(2): 49–61. [Google Scholar]
- Muratova E, Ivanova E. 2023. Identification of technological and economic performance indicators of a combine harvester for assessing its competitiveness. Lect Notes Netw Syst 575 LNNS: 1214–1220. https://doi.org/10.1007/978-3-031-21219-2_137 [Google Scholar]
- Narzullaev DZ, Ilhamov KS, Tursunov AT, Baydullaev AS, Akhmedov YA. 2023. Automation of the agricultural sector of the Republic of Uzbekistan. E3S Web Conf 392. https://doi.org/10.1051/e3sconf/202339201037 [Google Scholar]
- Nettle R, Kuehne G, Lee K, Armstrong D. 2018. A new framework to analyse workforce contribution to Australian cotton farm adaptability. Agron Sustain Dev 38(4): 38. https://doi.org/10.1007/s13593-018-0514-6 [Google Scholar]
- Norhajijah D, Mohiddin AK, Pebrian D. 2021. Exploring mechanization degree and capacity in Malaysia’s oil palm plantations. AgricEngInt: CIGR J 23(2): 220–228. [Google Scholar]
- Peng J, Zhao Z, Liu D. 2022. Impact of agricultural mechanization on agricultural production, income, and mechanism: evidence From Hubei Province, China. Front Environ Sci 10: 1–15. https://doi.org/10.3389/fenvs.2022.838686 [Google Scholar]
- Pishgar-Komleh SH, Ghahderijani M, Sefeedpari P. 2012. Energy consumption and CO2 emissions analysis of potato production based on different farm size levels in Iran. J Clean Prod 33: 183–191. https://doi.org/10.1016/j.jclepro.2012.04.008 [Google Scholar]
- Purnama I, Mutamima A, Aziz M, et al. 2025. Environmental impacts and the food vs. fuel debate: a critical review of palm oil as biodiesel. GCB Bioenergy 17(6): e70043. https://doi.org/10.1111/gcbb.70043 [Google Scholar]
- Ramirez-Contreras NE, Munar-Florez DA, Garcia-Nuñez JA, Mosquera-Montoya M, Faaij APC. 2020. The GHG emissions and economic performance of the Colombian palm oil sector; current status and long-term perspectives. J Clean Prod 258: 120757. https://doi.org/10.1016/j.jclepro.2020.120757 [CrossRef] [Google Scholar]
- Ramírez N, Munar D, Albarracin J, et al. 2024. Aceite de palma colombiano: huella de carbono y retos para una producción sosteible. Palmas (Colombia) 45(2): 20–39. [Google Scholar]
- Ruíz Álvarez E, Mosquera-Montoya M, Munevar DE, Vargas LE, Vélez Zape JC. 2022. Productividad laboral en plantaciones de palma de aceite en Colombia. Federación Nacional de Cultivadores de Palma de Aceite. https://doi.org/10.56866/9789588360966 [Google Scholar]
- Ruiz E, Banguera J, Pérez Toro W, Hernández Hernández J, Arévalo J, Mosquera Montoya M. 2020. Technical and economic assessment of two harvesting tools for young Elaeis oleifera x E. guineensis oil palms. Agron Colomb 38(3): 418–428. https://doi.org/10.15446/agron.colomb.v38n3.85303 [Google Scholar]
- Santhanam-Martin M, Wilkinson R, Cowan L, Nettle R. 2024. Elaborating decent work for agriculture: job experiences and workforce retention in the Australian orchard industry. J Rural Stud 111: 103330. https://doi.org/10.1016/j.jrurstud.2024.103330 [Google Scholar]
- Sharafi S, Kazemi A, Amiri Z. 2023. Estimating energy consumption and GHG emissions in crop production: a machine learning approach. J Clean Prod 408: 137242. https://doi.org/10.1016/j.jclepro.2023.137242 [Google Scholar]
- Syarifudin SM, Zareen Z. 2021. Impact of the agricultural technology transfer to the production of independent palm oil smallholders: a review. Food Res 5(4): 110–124. https://doi.org/10.26656/FR.2017.5(S4).007 [CrossRef] [Google Scholar]
- Unakitan G, Hurma H, Yilmaz F. 2010. An analysis of energy use efficiency of canola production in Turkey. Energy 35(9): 3623–3627. https://doi.org/10.1016/j.energy.2010.05.005 [Google Scholar]
- Yan F, Sun X, Chen S, Dai G. 2024. Does agricultural mechanization improve agricultural environmental efficiency? Front Environ Sci 11. https://doi.org/10.3389/fenvs.2023.1344903 [Google Scholar]
- Zapata-Hernández A, Ruiz-Álvarez E, Arias N, Mosquera-Montoya M, Cooman A. 2024. Adoption of mechanization alternatives in oil palm crops in the Colombian Orinoquía natural region. OCL - Oilseeds and Fats, Crops and Lipids 31. https://doi.org/10.1051/ocl/2024008 [Google Scholar]
- Zhu Y, Zhang Y, Piao H. 2022. Does agricultural mechanization improve agricultural environment efficiency? Evidence from China’s planting industry. Environ Sci Pollut Res 29(35): 53673–53690. https://doi.org/10.1007/s11356-022-19642-9 [Google Scholar]
Cite this article as: Ruiz-Alvarez E, Zapata-Hernández A. D, Cooman A, Arias Arias N, Munar Florez D, Ramírez-Contreras N. Mosquera Montoya M. 2026. Labour demand, economic profitability, energy efficiency, and greenhouse gas emissions: A comparative assessment of mechanization scenarios across yield gradients in oil palm crops in Colombia. OCL 33: 10. https://doi.org/10.1051/ocl/2026001
All Tables
Mechanization of technology options across scenarios (adapted from Zapata-Hernández et al., 2024).
Economic indicators (IRR, NPV, Total cost in mature stage (USD t⁻¹ FFB), Long-term total cost (USD t⁻¹ FFB), Net income (USD ha⁻¹), Benefit–cost ratio, and Payback period).
All Figures
|
Fig. 1 (a) Workdays per hectare per year at different yield levels (FFB) and mechanization intensities; (b) Workdays per ton of FFB; (c) Area per worker (ha). |
| In the text | |
|
Fig. 2 Composition of energy inputs and outputs by scenario. |
| In the text | |
|
Fig. 3 Energy efficiency indicators (energy ratio, energy productivity, specific energy, and net energy) for Elaeis guineensis plantations under Scenario 1 (S1), Scenario 2 (S2) and Scenario 3 (S3). |
| In the text | |
|
Fig. 4 Greenhouse gas emissions in Elaeis guineensis plantations under Scenario 1 (S1), Scenario 2 (S2) and Scenario 3 (S3). |
| In the text | |
|
Fig. 5 CO2 emissions per tonne of FFB by scenario. |
| In the text | |
|
Fig. 6 Costs by scenario (USD ha⁻¹ yr⁻¹). |
| In the text | |
Current usage metrics show cumulative count of Article Views (full-text article views including HTML views, PDF and ePub downloads, according to the available data) and Abstracts Views on Vision4Press platform.
Data correspond to usage on the plateform after 2015. The current usage metrics is available 48-96 hours after online publication and is updated daily on week days.
Initial download of the metrics may take a while.