")
")
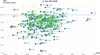
Fig. 2

Download original image
Yield of the genotypes in percentage of controls (y) in function of their oil content in percentage (x). a: Orange points are elite WOSR controls, blue points are hybrids derived from P1 tested in 2016–2017; b: Yellow points are elite WOSR controls, green points are hybrids derived from P2, blue points are hybrids derived from P1 tested in 2017–2018.
Current usage metrics show cumulative count of Article Views (full-text article views including HTML views, PDF and ePub downloads, according to the available data) and Abstracts Views on Vision4Press platform.
Data correspond to usage on the plateform after 2015. The current usage metrics is available 48-96 hours after online publication and is updated daily on week days.
Initial download of the metrics may take a while.