")
")
| Issue |
OCL
Volume 33, 2026
Lipids and Cosmetics / Lipides et cosmétiques
|
|
|---|---|---|
| Article Number | 14 | |
| Number of page(s) | 14 | |
| DOI | https://doi.org/10.1051/ocl/2026004 | |
| Published online | 31 March 2026 | |
Research article
Optimization of synthesis conditions for Calophyllum inophyllum L.-loaded solid lipid nanoparticles☆
Optimisation des conditions de synthèse de nanoparticules lipidiques solides chargées en Calophyllum inophyllum L.
1
Faculty of Chemical Engineering, Ho Chi Minh City University of Technology (HCMUT), 268 Ly Thuong Kiet Street, Dien Hong Ward, Ho Chi Minh City, Vietnam
2
Vietnam National University Ho Chi Minh City, Linh Xuan Ward, Ho Chi Minh City, Vietnam
3
Department of Chemical Engineering and Processing, Nong Lam University, Thu Duc District, Ho Chi Minh City, Vietnam
4
Department of Chemical Engineering, Faculty of Chemical Engineering and Food Technology, Nong Lam University, Ho Chi Minh, Vietnam
5
Department of Natural Products, Faculty of Chemical Engineering and Food Technology, Nong Lam University, Thu Duc District, Ho Chi Minh City, Vietnam
* Corresponding author: This email address is being protected from spambots. You need JavaScript enabled to view it.
Received:
1
October
2025
Accepted:
29
January
2026
Abstract
Background: This study aimed to optimize the synthesis conditions for solid lipid nanoparticles (SLNs) loaded with Calophyllum inophyllum L. (tamanu) oil, a natural extract known for its anti-inflammatory, antimicrobial, and wound-healing properties. Methods: SLNs were prepared using a hot homogenization–ultrasonication–cold homogenization method, and various formulation parameters were systematically evaluated, including the type and concentration of solid lipids, hydrophilic–lipophilic balance (HLB) of surfactants, sonication power, and homogenization speeds. Results: Among the tested lipids, Naterol® SE produced stable SLNs and was selected for further optimization. Response Surface Methodology (RSM) with a Central Composite Design (CCD) was applied to model the effects of four key factors—HLB value, sonication power, hot homogenization speed, and cold homogenization speed—on particle size and polydispersity index (PDI). The optimized formulation achieved a mean particle size of 148.7 ± 1.39 nm and a PDI of 0.30, with spherical morphology confirmed by SEM and good physical stability under different storage conditions. Objectives: These findings demonstrate that the optimized tamanu oil-solid lipid nanoparticles (TO-SLNs) possess favorable physicochemical characteristics, offering strong potential as a topical nanocarrier system for skin repair and regeneration applications.
Résumé
Contexte: Cette étude visait à optimiser les conditions de synthèse de nanoparticules lipidiques solides (NLS) chargées en huile de Calophyllum inophyllum L. (tamanu), un extrait naturel reconnu pour ses propriétés anti-inflammatoires, antimicrobiennes et cicatrisantes. Méthodes : Les NLS ont été préparées par une méthode combinant homogénéisation à chaud, ultrasonication et homogénéisation à froid. Différents paramètres de formulation ont été évalués de manière systématique, notamment le type et la concentration en lipides solides, l’équilibre hydrophile-lipophile (HLB) des tensioactifs, la puissance de sonication ainsi que les vitesses d’homogénéisation. Résultats : Parmi les lipides testés, le Naterol® SE a permis d’obtenir des NLS stables et a été retenu pour l’optimisation. Une méthodologie RSM (Response Surface Methodology) basée sur un plan composite central (Central Composite Design, CCD) a été appliquée afin de modéliser l’effet de quatre facteurs clés — la valeur du HLB, la puissance de sonication, la vitesse d’homogénéisation à chaud et la vitesse d’homogénéisation à froid — sur la taille des particules et l’indice de polydispersité (PDI). La formulation optimisée a permis d’obtenir une taille moyenne de particules de 148,7 ± 1,39 nm et un PDI de 0,30. La morphologie sphérique a été confirmée par microscopie électronique à balayage (MEB), et une bonne stabilité physique a été observée dans différentes conditions de stockage. Objectifs : Ces résultats montrent que les nanoparticules lipidiques solides à base d’huile de tamanu (TO-NLS) optimisées présentent des caractéristiques physico-chimiques favorables, offrant un fort potentiel en tant que système nanovecteur topique pour des applications de réparation et de régénération cutanées.
Key words: Solid lipid nanoparticles (SLNs) / Calophyllum inophyllum L / Tamanu oil / Sonication power
Mots clés : Nanoparticules lipidiques solides (NLS) / Calophyllum inophyllum L / Huile de tamanu / Puissance de sonication
Contribution to the Topical Issue: “Lipids and Cosmetics / Lipides et cosmétiques”.
© S.T. Ly Published by EDP Sciences, 2026
 This is an Open Access article distributed under the terms of the Creative Commons Attribution License (https://creativecommons.org/licenses/by/4.0), which permits unrestricted use, distribution, and reproduction in any medium, provided the original work is properly cited.
Highlights
Naterol® SE produced stable solid lipid nanoparticles (SLNs) loaded with Calophyllum inophyllum L. (tamanu) oil.
The optimized formulation achieved a mean particle size of 148.7 ± 1.39 nm and a PDI of 0.30, with spherical morphology confirmed by SEM.
These nanoparticles (SLN-tamanu oil) were found to be physically stable under a range of storage conditions (refrigerated, room temperature, and elevated temperature), demonstrating their robustness for potential commercial use.
1 Introduction
Tamanu oil (TO), extracted from the nuts of Calophyllum inophyllum L., comes from an evergreen tree that flourishes in tropical coastal regions of Asia, Africa, and the Pacific Islands. The oil extraction process involves pressing the seeds to produce a rich, dark green oil known for its distinct nutty aroma. Studies have shown that tamanu oil possesses anti-inflammatory, antimicrobial, and wound-healing properties, making it a valuable asset in natural skincare and traditional medicine (Pribowo et al., 2021). The composition of crude tamanu oil contains 71.5%–90.3% fat and 9.7%–28.5% resin. The fatty acid composition of tamanu oil includes palmitic acid (16.5 ± 1.59%), stearic acid (30.2 ± 4.36%), oleic acid (23.6 ± 4.77%), and linoleic acid (25.5 ± 3.87%). Minor components consist of palmitoleic acid (0.26 ± 0.11%), alpha-linolenic acid (0.26 ± 0.05%), arachidonic acid (0.6 ± 0.09%), gadoleic acid (0.3 ± 0.1%), dihomo-gamma-linolenic acid (< 0.1%), behenic acid (0.1 ± 0.15%), and docosadienoic acid (1.4 ± 5.08%) (Raharivelomanana et al., 2018). Tamanu oil harbors key bioactive constituents including 4-phenylcoumarin derivatives, calophyllolide, and inophyllolide compounds. Xanthones and coumarin derivatives have been shown to exert inhibitory effects on the proliferation of various cancer cell types, including those originating from the prostate, kidney, breast, larynx, lung, and colon, as well as central nervous system tumors, leukemia, and malignant melanoma (Hapsari et al., 2023). Calophyllolide has been reported to possess strong anti-inflammatory properties, particularly when compared to hydrocortisone (10 mg), which was used as the positive control in formaldehyde induced arthritis models, showing an effectiveness from its efficient dose (ED) of 140mg/kg and its lethal dose (DL) of 2.5g/kg (Raharivelomanana et al., 2018). Inophyllum C, E, and A have been reported to exhibit both anticancer and anti-HIV activities. In contrast, inophyllum P and B demonstrate promising potential as HIV inhibitors (Hapsari et al., 2023). Furthermore, tamanu oil has been recognized for its wound-healing capacity, antioxidant activity, antimicrobial effects, and ultraviolet (UV) absorption properties (Ferdosh, 2024; Raharivelomanana et al., 2018).
Recent advancements in materials science and nanotechnology have enabled the precise fabrication of materials with particle sizes spanning from the micrometer to the nanometer scale. Nanoparticles with small size and very large surface area make them easily pass through biological cell membranes, are good drug delivery systems and interact quickly with biological systems in the body. However, nanomaterials with excellent biodegradability and biocompatibility are considered to be the best vehicles for drug delivery systems in biomedical applications (Duan et al., 2020). Consequently, nanocarriers are being actively explored in the pharmaceutical and medical fields for applications such as biosensing, imaging, and targeted drug delivery. Nanoparticle- based drug carriers under research include dendrimers, metallic nanoparticles, and quantum dots that are either conjugated or coated with drug molecules on their surface, and lipid-based nano-carriers which include nanoemulsions, polymeric nanoparticles, niosomes, solid lipid nanoparticles (SLN), and liposomes (Mirchandani et al., 2021). Among these diverse platforms, lipid-based systems are particularly attractive due to their inherent biocompatibility and use of physiologically safe components. Specifically, Solid Lipid Nanoparticles (SLNs) developed to synergistically combine the advantages of other systems, such as the stability of polymeric nanoparticles and the biocompatibility of liposomes and emulsions (Garud et al., 2012; Mirchandani et al., 2021). The solid matrix in SLNs also proposes to protect the loaded therapeutic molecules against the rough biological environment and also shield the other chemical degradations with maximum feasibility to alter the release profiles of the therapeutic molecule. Altogether, these proficiencies make the SLNs an exceptional carrier system (Sastri et al., 2020). Therefore, solid lipid nanoparticles (SLNs) have attracted considerable global research interest due to their potential to achieve controlled and site-specific drug delivery, minimize toxicity, enhance bioavailability, and improve the overall pharmacokinetic performance of therapeutic agents (Badawi et al., 2018; Mirchandani et al., 2021). In a patent application from the early 1990s, Müller and Lucks were the first to describe SLNs and the production process (Viegas et al., 2023). And since then, this term has been used more and more widely in research and many applications in several areas of life, such as pharmaceuticals, cosmetics and personal care, food and nutraceuticals. Solid lipid nanoparticles (SLNs) are the first generation of lipid-based nanocarriers that are formulated from lipids, which are solid at body temperature and stabilized by emulsifiers (Ghasemiyeh and Mohammadi-Samani, 2018).
Although previous studies have highlighted the therapeutic potential of tamanu oil and SLNs, many of them relied on one-variable-at-a-time experimental designs, in which formulation or processing parameters were optimized individually without considering their interactions. In addition, key process variables such as surfactant HLB value, sonication energy, and homogenization conditions were often fixed or insufficiently explored, while stability evaluations were frequently limited to short-term observation under a single storage condition, resulting in inconsistent stability outcomes across studies (Mai et al., 2019). To address this gap, the present study applies Response Surface Methodology (RSM) with Central Composite Design (CCD) to systematically optimize formulation parameters. This approach ensures robust particle size control, improved stability, and enhanced applicability in pharmaceutical and cosmeceutical fields.
2 Materials and methods
2.1 Materials
Calophyllum inophyllum refined oil (tamanu oil) was kindly gifted from Nong Lam University. The physico-chemical properties of the refined tamanu oil are summarized in Table 1 (Supplementary Material), including viscosity (42.9 mPa·s), relative density (0.9102 ± 0.0001), acid value (0.112 ± 0.001 mg KOH/g sample), and saponification value (180.837 ± 2.355 mg KOH/g sample). Cetiol® SB 45 (the melting points: 42–46 °C) was purchased from BASF (Germany). Naterol® SE (the dropping point: 49–51 °C) and Naterol® 165 CN (the melting points: 55–59 °C) were purchased from CISME (Italy). IMWITOR® 900 K (the melting points: 54—-66 °C) from IOI Oleo (Germany). Compritol® 888 CG ATO (the melting points: 70–75 °C) was purchased from Gattefossé (France). All other chemicals including Tween 80 from Evonik (Germany) and Span 80 from Croda (Singapore).
Relationship between coded variables and factor levels.
2.2 Preparation of Tamanu Oil-Load SLNs
In this study, solid lipid nanoparticles (SLNs) loaded with tamanu oil were prepared using the hot homogenization–sonication–cold homogenization method as described by Carlotti et al., (2012). Briefly, tamanu oil and solid lipid were melted together above the lipid melting point from 5–10 °C above their respective melting points and dispersed into a pre-heated aqueous surfactant solution followed by high-shear homogenization to form a coarse emulsion, probe sonication to reduce droplet size, and cold homogenization was performed at 0–5 °C to solidify the lipid matrix and obtain stable nanoparticles. To further optimize the formulation, several critical factors were systematically investigated. The effect of tamanu oil content (1.5–3.5% w/v) and total oil phase (6.5–8.5% m/v) was examined to determine their impact on particle size distribution. The hydrophilic–lipophilic balance (HLB) of Tween 80/Span 80 surfactant blends was varied across values of 9–13 to evaluate emulsification efficiency. Hot homogenization speed (8,000–12,000 rpm), sonication power (50–90% amplitude), and cold homogenization speed (8,000–12,000 rpm) were individually studied to understand their role in droplet disruption, particle stabilization, and final solidification. Collectively, these systematic experiments provided the basis for identifying optimal synthesis parameters to produce uniform, stable, and reproducible tamanu oil-loaded SLNs with desirable physicochemical properties.
2.3 Particle size analysis
The dynamic light scattering (DLS) technique was chosen for particle size as z-average diameter, PDI, and zeta potential of TO-SLNs evaluation by the using of Zetasizer Nano ZS (Malvern, United Kingdom). All analyses were performed in auto-measuring mode at 25 °C and the results were presented as the average value of triplicate samplings.
2.4 Stability of Tamanu Oil-Loaded SLNs
To assess the stability of the TO-SLNs, we conducted sensitivity experiments with different temperature (45 °C, room temperature and 10 °C) and UV light exposure. In parallel, a blank sample (SLN-FREE), a solid lipid suspension without tamanu oil, was prepared as a reference sample for a comparison of the stability of SLNs.
2.5 Optimization TO-loaded SLNs of synthetic procedure by RSM
The synthesis procedure of tamanu oil-loaded SLNs was statistically optimized using RSM-CCD design. Four independent variables were selected as critical formulation factors: HLB (A), sonication power (B), hot homogenization speed (C), and cold homogenization speed (D). A total of thirty experimental runs were generated, including sixteen factorial points to assess linear and interaction effects, eight axial (star) points to capture quadratic responses and curvature, and six center points to estimate experimental error.
After identifying the central values of the key formulation variables, experimental regions were established for four independent factors: HLB value (A), sonication power (B), hot homogenization speed (C), and cold homogenization speed (D). The center points were set at HLB = 11, sonication power = 60%, hot homogenization = 10,000 rpm, and cold homogenization = 10,000 rpm, with survey ranges spanning from HLB 9–13, sonication 40–80%, and homogenization speeds 8,000–12,000 rpm. To ensure orthogonality and facilitate correlation analysis, all factor levels were encoded into dimensionless units, where the central point was assigned a value of 0, the lowest and highest levels were coded as −2 and +2, and intermediate values as −1 and +1. The relationship between actual and coded factor levels is summarized in Table 1.
2.6 Statistical analysis
All experiments were performed in triplicate, and the data are presented as mean ± standard deviation (SD). Statistical analyses were conducted using Design-Expert® software (version XX, Stat-Ease Inc., Minneapolis, MN, USA) for model fitting and response surface methodology (RSM). Analysis of variance (ANOVA) was applied to evaluate the significance of the regression models and individual terms. Differences were considered statistically significant at p < 0.05.
3 Results
The experiments in this study were conducted in two stages. First, preliminary single-factor tests were performed to examine the effects of lipid type, lipid concentration, HLB value, sonication power, and homogenization speeds. These results helped define suitable working ranges and select the most stable lipid system.
In the second stage, four key factors (HLB, sonication power, hot and cold homogenization speeds) were optimized simultaneously using RSM–CCD to determine the conditions that yield the smallest and most uniform SLNs.
Accordingly, the results are presented in two parts: (3.1) Preliminary experiments and factor screening, and (3.2) RSM–CCD optimization.
3.1 Preliminary experimental and factor screening results
3.1.1 Selection of suitable Solid Lipids for SLNs
To establish an appropriate foundation for the optimization study, an initial screening was conducted to identify the most suitable solid lipid for forming stable tamanu oil-loaded SLNs. In this stage, five different solid lipids were tested under identical processing conditions (Tab. 2). All SLNs were produced using a standardized process consisting of hot homogenization (10 minutes at 8,000 rpm), probe sonication (10 minutes at 80% power), and cold homogenization (10 minutes at 8,000 rpm). All tested solid lipids were evaluated at the same concentration to ensure a fair comparison. The formulation consisted of 2.5% (w/w) solid lipid, 5% (w/w) tamanu oil, 3.6% (w/w) Tween 80, 1.4% (w/w) Span 80, and distilled water added to 100%. The tested lipids included Naterol® 165 CN, Naterol® SE, IMWITOR® 900 K, Compritol® 888 ATO. Cetiol® SB 45 was excluded from further analysis because it did not form a stable dispersion during preparation. This preliminary screening provided the basis for identifying the lipid system with the most favorable particle size and stability for subsequent optimization.
The SLNs prepared with Naterol® 165 CN exhibited the smallest average particle size of 157.5 nm with a PDI of 0.32, indicating a relatively narrow size distribution. Naterol® SE produced SLNs with a slightly larger average size of 275.2 nm but a lower PDI of 0.259, suggesting a more uniform particle population. Imwitor® 900 K and Compritol® 888 CG ATO resulted in significantly larger particles, measuring 322.0 nm (PDI = 0.518) and 886.3 nm (PDI = 1.000), respectively, with Compritol-based SLNs showing a very broad size distribution and poor uniformity. Despite the smaller particle size achieved with Naterol® 165 CN, this formulation demonstrated physical instability, as evidenced by sedimentation occurring within one week of storage. In contrast, SLNs formulated with Naterol® SE remained physically stable without sedimentation, making it the preferred lipid for further optimization. These findings are consistent with previous reports indicating that glycerol stearate–based lipids such as Naterol® SE provide better emulsification properties and improved compatibility with amphiphilic surfactants, leading to more uniform particle populations and reduced sedimentation (Ghasemiyeh and Mohammadi-Samani, 2018; Sastri et al., 2020).
Z-average and PDI of SLNs formulated by different solid lipid.
3.1.2 Determining the effect of the solid lipid ratio factor
To further refine the SLN formulation, the next step was to evaluate how the ratio of solid lipid affects particle size and dispersion quality. After identifying Naterol® SE as the most stable lipid system in Section 3.1.1, different proportions of solid lipid were investigated to determine the concentration range that supports efficient nanoparticle formation.
As demonstrated in Figure 1, an increase in solid lipid concentration from 1.5% to 3.5% (w/v) resulted in a progressive increase in the Z-average diameter of the SLNs, from 152.58 nm to 356.25 nm. This clear upward trend suggests that higher lipid content contributes significantly to the formation of larger nanoparticles. Similar observations have been reported in earlier studies. Müller et al. demonstrated that an increase in lipid concentration beyond an optimal range reduced emulsification efficiency, yielding particles with larger sizes and lower stability (Müller et al., 2000). Mehnert and Mäder (2012) also emphasized that excess lipid can crystallize irregularly during cooling, further increasing heterogeneity and polydispersity.
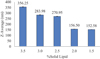 |
Fig. 1 Effect of solid lipid concentration on particle size (Z-Average). |
3.1.3 Determining the effect of the HLB factor
To evaluate how surfactant polarity influences SLN formation, the effect of different HLB values in the surfactant blend was investigated. This experiment helps determine the appropriate HLB range required to obtain stable tamanu oil-loaded SLNs with small particle size.
The HLB (hydrophilic-lipophilic balance) of the surfactant blend significantly influenced the particle size of SLNs (Fig. 2). Among the tested HLB values (9 to 13), the smallest particle size (158.70 nm) was obtained at an HLB of 11. Deviations from this optimal HLB, either higher (13) or lower (9), resulted in larger particle sizes, with the highest value reaching 282.10 nm. These findings are consistent with recent studies that emphasize the importance of HLB optimization for lipid-based carriers, especially for achieving nanoscale dispersion and long-term stability (Ohadi et al., 2020; Patel et al., 2021).
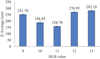 |
Fig. 2 Effect of HLB on particle size (Z-Average). |
3.1.4 Determining the effect of the sonication power factor
Sonication power plays an important role in reducing droplet size during emulsification, as ultrasonic cavitation helps break large droplets into smaller ones. Therefore, this section evaluates how different sonication power levels influence the particle size of tamanu oil-loaded SLNs.
The impact of sonication amplitude on the Z-average particle size of SLNs, as illustrated in Figure 3, reveals a notable U-shaped trend. Increasing the amplitude from 50% to 60% significantly reduced the particle size, reaching a minimum of 136.30 nm at 60% power. However, beyond this optimal point, further increases in sonication power (70%–90%) led to a counterintuitive rise in particle size, with the highest value recorded at 285.95 nm at 90% power. This U-shaped relationship can be explained by the balance between droplet disruption and destabilization (Shah et al., 2024). Moderate sonication energy provides sufficient cavitation and shear to break down lipid droplets, while excessive energy generates local overheating and turbulent microenvironments that promote coalescence and destabilization of surfactant films (Gao and Meng, 2024).
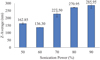 |
Fig. 3 Effect of sonication power on particle size. |
3.1.5 Determining the effect of the hot homogenization speed factor
Hot homogenization speed plays an important role in reducing droplet size during the initial emulsification step. To evaluate its influence on SLN formation, different homogenization speeds were tested while keeping all other parameters constant.
As the homogenization speed increases from 8,000 rpm to 10,000 rpm, there is a noticeable decrease in particle size from 270.95 nm to 237.20 nm (Fig. 4). This trend can be attributed to the enhanced shear forces at higher speeds, which effectively break down lipid droplets into smaller particles. Higher processing temperatures during hot homogenization reduce the viscosity of the lipid phase, facilitating the formation of smaller particles (Mukherjee et al., 2009). However, further increasing the homogenization speed to 11,000 rpm and 12,000 rpm resulted in a slight increase in particle size to 252.60 nm and 258.30 nm, respectively. The findings highlight that hot homogenization must be carefully controlled to maximize energy efficiency without exceeding the stability threshold of the emulsion (Håkansson, 2019).
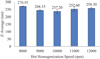 |
Fig. 4 Effect of hot homogenization speed on particle size. |
3.1.6 Determining the effect of the cold homogenization speed factor
Cold homogenization speed factor investigates how different cold homogenization speeds influence the final size of SLNs.
The influence of cold homogenization speed on particle size is illustrated in Figure 5. The Z-average shows a distinct dependence on the homogenization speed. As the speed increases from 8,000 to 10,000 rpm, the average particle size decreases from 270.95 nm to 232.15 nm. However, further increasing the speed to 11,000 and 12,000 rpm leads to a paradoxical increase in particle size, with Z-averages of 264.20 nm and 281.55 nm, respectively. The increase at higher speeds can be attributed to excessive mechanical stress during lipid crystallization, which may interfere with surfactant adsorption or induce particle aggregation. Conversely, insufficient homogenization leads to incomplete dispersion (Gao and Meng, 2024; Khairnar et al., 2022). Therefore, an intermediate cold homogenization speed (around 10,000 rpm) provides the best balance between mechanical mixing and structural stabilization, supporting efficient solidification of the lipid matrix.
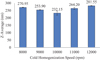 |
Fig. 5 Effect of cold homogenization speed on particle size. |
3.2 RSM–CCD optimization results
From the appropriate intervals in section 3.1, four major factors—HLB value, sonication power, hot homogenization speed, and cold homogenization speed—were simultaneously evaluated to determine their individual and interactive effects on particle size. Table 3 summarized the suitable parameters for producing SLN-loaded with tamanu oil.
Summary of optimal conditions.
3.2.1 Optimization of SLNs size
The independent variables studied were: HLB value, sonication power (%), hot homogenization speed (rpm), and cold homogenization speed (rpm). The responses measured included the Z-average particle size (Y1, in nm) and the polydispersity index (Y2, PDI), both critical for evaluating the quality and stability of the SLNs formulation (Tab. 4).
Experimental design matrix and results for SLN-loaded Calophyllum inophyllum L. extract.
3.2.2 Overview of Z-average results
The Z-average values obtained from the 30 experimental runs were analyzed to assess how the combined formulation influenced particle size behavior across the CCD model.
Across the 30 runs, Z-average values ranged from 140.3 nm to 228.3 nm, while PDI ranged from 0.149 to 0.48 (Fig. S6). This wide distribution demonstrates that the formulation and process variables significantly influence both particle size and size distribution. Notably, the five replicated center point runs (Runs 25–30) with HLB = 11, sonication power = 60%, hot homogenization = 10,000 rpm, and cold homogenization = 10,000 rpm consistently yielded the smallest Z-average values (140.3–141.7 nm), with a mean around 141 nm, indicating high reproducibility and formulation robustness. The HLB value exerted a considerable influence on particle size. Under identical process conditions (Runs 17, 18, and 25–30), decreasing the HLB to 9 (Run 17) or increasing it to 13 (Run 18) led to much larger particle sizes −223.7 nm and 228.3 nm, respectively - compared to 141 nm at HLB 11. This confirms that optimal emulsification and stabilization occur when the HLB of the surfactant system is closely matched to the polarity of the lipid phase, with HLB 11 emerging as the optimal value (Miranda-Olvera et al., 2025). The influence of sonication power followed a non-linear trend. At constant HLB = 11 and homogenization speeds, 60% sonication (Run 25: 141.2 nm) yielded the smallest particles. Both lower (40%, Run 19: 173.4 nm) and higher power (80%, Run 20: 174.6 nm) produced larger particles. This trend supports the hypothesis that low power provides insufficient droplet disruption, while excessive power may cause local overheating and bubble formation, disrupting surfactant stabilization and promoting coalescence.
Hot homogenization generally improved particle size reduction up to an optimal point. At fixed HLB and sonication settings (Runs 21, 25, and 22), increasing the hot homogenization speed from 8,000 rpm to 10,000 rpm reduced Z-average from 144.9 nm to 141.2 nm, while a further increase to 12,000 rpm led to a larger particle size of 150.8 nm. This suggests that 10,000 rpm is the optimal setting, beyond which shear forces may destabilize emulsified droplets. Cold homogenization speed also showed a complex influence. Comparing Runs 23 and 24 (8,000 rpm vs. 12,000 rpm) at fixed HLB and sonication, increasing cold homogenization speed increased particle size from 187.7 nm to 214.2 nm. Excessive mechanical stress during the lipid solidification phase may interfere with surfactant film formation or induce aggregation, suggesting that moderate cold homogenization is more favorable.
3.2.3 Further analysis of polydispersity index (PDI)
A detailed evaluation of the PDI was conducted to assess the uniformity of particle size distribution and its relevance to SLN stability.
PDI values ranged from 0.149 to 0.48 across 30 experimental runs (Fig. S7). The lowest PDI (0.149) was observed in Run 4, which combined HLB 12, sonication power of 70%, hot homogenization at 9,000 rpm, and cold homogenization at 9,000 rpm. Interestingly, this run also had a moderate particle size (187.3 nm), suggesting that a narrow size distribution can occur even when the average size is not minimized - highlighting that PDI and Z-average are related but not always directly proportional. The most consistent and favorable PDI values were observed in the five replicated center point runs (Runs 25–30), all with HLB = 11, sonication power = 60%, hot and cold homogenization = 10,000 rpm. These runs yielded PDIs ranging from 0.283 to 0.312, with an average of 0.305. While slightly above the strict 0.3 threshold, these values are still within an acceptable range for practical formulations and indicate good reproducibility and formulation stability. On the contrary, some runs showed significantly higher PDI values, exceeding 0.4 (Run 15 and Run 7). These results suggest that higher sonication powers (70–90%) and simultaneously high homogenization speeds may increase shear-induced droplet coalescence or result in poor surfactant film formation during emulsification and solidification. This leads to a broader size distribution and is reflected in higher PDI values. Interestingly, PDI values were not solely dependent on the average particle size (Run 13 and Run 18). This again highlights that a formulation can produce small particles but with broad size variation, depending on how uniformly the energy (sonication/homogenization) is distributed and how effectively the surfactants stabilize the system (Rehman et al., 2024).
Overall, the results demonstrate that both formulation factors and processing conditions strongly influence PDI. Among the tested variables, HLB, sonication power, and cold homogenization speed appeared to have the most pronounced effects on particle uniformity. Moderate sonication (60%), balanced homogenization speeds (around 10,000 rpm), and an HLB of 11 consistently produced lower PDI, reinforcing their selection for optimal nanoparticle formulation.
3.2.4 Statistical analysis and model fitting
The statistical analysis indicates that the fitted model is statistically significant, with an F-value of 15.43 and a p-value less than 0.0001. This implies that the model effectively explains the variability in SLNs particle size, and the likelihood that such a strong model arises purely by random chance is extremely low. The resulting regression equation, in coded terms, is:
 (1)
(1)
In which:
A-HLB
B-Sonication Power (%)
C-Hot homogenization speed (rpm)
D-Cold homogenization speed (rpm)
In the statistical evaluation of model fit (Tab. 5), the quadratic regression model for SLNs particle size exhibits both high precision and strong explanatory power, yet reveals areas for further refinement. The coefficient of determination, R2 = 0.9351, signifies that 93.51% of the total variability in SLNs size is captured by the six retained terms, while the adjusted R2 = 0.8745 remains high after penalizing for model complexity, indicating that the majority of predictors contribute meaningfully rather than inflating fit artificially. In practice, this model can guide the initial optimization of HLB, sonication energy, and cold homogenization parameters, provided that follow-up experiments are performed to validate and, if necessary, refine the predicted optimum regions.
In order to evaluate the adequacy of the fitted quadratic regression model for SLNs particle size, a formal lack-of-fit test was conducted (Tab. 6). The model itself is highly significant, with an overall F-value of 15.43 (p < 0.0001), confirming that the chosen factors and their quadratic terms explain a substantial portion of the observed variability.
Variance analysis results of the Ysize objective function.
Model fit analysis table using F and P values.
3.2.5 Response surface models
Response surface models provide an overview of the dependence and interaction of the factors of HLB with sonication power, hot homogenization speed, and cold homogenization speed (Figs. 6 and 7).
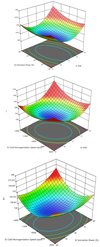 |
Fig. 6 3D Response surface of formulation factors on SLNs size. |
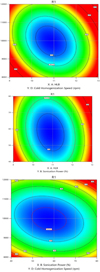 |
Fig. 7 Contour plots of formulation factors on SLNs size. |
3.2.6 Determination of optimal point
Based on the constructed quadratic model and numerical optimization tools, the optimal point for minimizing Z-average particle size was identified. The optimal conditions suggested by the model were displayed at Table 7. At these optimized parameters, the predicted Z-average (Y1) of the SLNs was 143.28 nm, indicating a highly uniform and nanoscale particle size ideal for topical and pharmaceutical applications.
Optimization conditions for Z-average.
3.2.7 Evaluation of the properties of optimal SLNs
3.2.7.1 Size and PDI
The model predicted a Z-average of 143.28 nm. The experimental values and corresponding relative errors are shown in Table 8.
The experimental Z-average values ranged from 147.7 to 150.4 nm, with relative errors of 3.08% to 4.98% compared to the predicted model value of 143.28 nm. The average particle size across all three trials was 148.7 ± 1.39 nm, which closely aligns with the model prediction and confirms the practical reliability of the optimization approach. The polydispersity index (PDI) ranged between 0.291 and 0.309, indicating a narrow and consistent particle size distribution. Although slightly above the 0.3 threshold for strict monodispersity, these values still reflect high formulation uniformity suitable for pharmaceutical use. Comparable results have been reported in earlier studies on SLNs. Badawi et al. (2018) achieved mean particle sizes of 145–160 nm with PDI values around 0.28–0.32 for pomegranate extract-loaded SLNs, emphasizing the robustness of similar lipid-based nanocarriers in maintaining nanoscale dimensions with moderate monodispersity (Badawi et al., 2018). Meanwhile, Zhao et al. (2022) formulated SLNs with mean size 113.0 ± 0.8 nm at PDI 0.177 ± 0.007, demonstrating that smaller sizes with lower PDI are achievable depending on lipid/surfactant composition (Zhao et al., 2022).
Experimental vs. predicted Z-average.
3.2.7.2 Zeta potential
The zeta potential values measured for the optimized SLNs formulation across three independent batches were −5.25 mV, −5.35 mV, and −5.64 mV, respectively (Tab. 9). These results indicate that the nanoparticles possess a slightly negative surface charge, which is primarily attributed to the weak ionization of the lipid matrix and any residual charges from the encapsulated tamanu oil or surfactants (Nair et al., 2022). Similar findings were noted by Beloqui et al. (2016), who observed that SLN systems formulated with non-ionic surfactants generally display low negative zeta potentials, typically in the range of −5 to −15 mV. In such cases, the long-term stability of the dispersion is maintained predominantly through steric effects provided by the surfactant layer rather than by strong electrostatic repulsion (Beloqui et al., 2016).
Zeta potential of optimal SLNs.
3.2.7.3 Stability of Tamanu Oil-Loaded SLNs
Temperature plays a crucial role in the behavior of solid lipid nanoparticles, as short-term exposure to elevated temperatures during transportation, packaging, storage, or sterilization can significantly affect their physicochemical stability (Sun et al., 2020).
The stability of the optimized sample was evaluated by monitoring for any signs of phase separation under three different storage conditions: refrigeration (0–10 °C), room temperature (30–33 °C), and incubator conditions (45 °C). Evidence of phase separation under these storage conditions is illustrated in Figures 8–10.
Figures 8–10 illustrate the effect of storage conditions on SLNs stability. Under refrigeration (0–10 °C), both samples remained intact without visible separation, confirming good stability at low temperature. At room temperature (30–33 °C), the dispersions also showed no obvious creaming or sedimentation over two weeks, indicating that steric stabilization by surfactants was sufficient for short-term storage. In contrast, incubation at 45–50 °C led to partial phase separation, suggesting that thermal stress accelerates lipid polymorphic transitions and weakens surfactant adsorption (Cholakova et al., 2020). Our results are consistent with the observations of Ball et al. (2017), who reported that keeping SLNs under refrigeration delays lipid recrystallization processes, thereby improving their stability relative to samples stored at room temperature or higher (Ball et al., 2017).
The particle size and polydispersity index (PDI) of tamanu oil-loaded SLNs were monitored over 15 days under three storage conditions (0–10 °C, 30–33 °C, and 45 °C) (Fig. 11). Overall, the SLNs exhibited good size stability during the storage period, with Z-average values remaining within a narrow range of approximately 120–150 nm.
At 0–10 °C and 30–33 °C, only minor fluctuations in particle size and PDI were observed (Fig. 12), indicating that the SLN system remained physically stable without noticeable aggregation or phase separation. In contrast, samples stored at 45 °C showed a gradual decrease in Z-average size and a slight increase in PDI, suggesting partial destabilization of the lipid matrix at elevated temperature.
Nevertheless, the PDI values remained below 0.35 throughout the study, demonstrating an acceptable size distribution and confirming that the tamanu oil-loaded SLNs maintain satisfactory short-term stability under refrigerated and ambient storage conditions.
Overall, these results are consistent with previous studies and confirm that the SLN system exhibits satisfactory stability under recommended storage conditions (Mai et al., 2019).
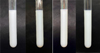 |
Fig. 8 Optimal samples 1 (left) and 2 (right) under refrigeration conditions (0–10 °C) over 2 weeks. |
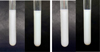 |
Fig. 9 Optimal samples 1 (left) and 2 (right) under room conditions (30–33 °C) over 2 weeks. |
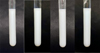 |
Fig. 10 Optimal samples 1 (left) and 2 (right) under room conditions (45–50 °C) over 2 weeks. |
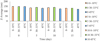 |
Fig. 11 Z-average particle size of tamanu oil–loaded SLNs during storage at different temperatures. |
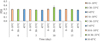 |
Fig. 12 PDI values of tamanu oil-containing SLNs during storage at different temperatures. |
3.2.7.4 SEM (scanning electron microscope)
The SEM image taken at 100000 × magnification (Fig. 13a) shows a solid lipid nanoparticle exhibiting near-spherical morphology with smooth surface textures. The diameter of this particle was estimated in the range between 170 and 175 nm. The SEM image at 25000× magnification (Fig. 13b) provides an overview of a larger field containing SLNs. This image reveals a population of solid lipid nanoparticles exhibiting predominantly small particle sizes, with generally spherical morphology and relatively smooth surfaces. While a few larger particles are visible in the field, they might be above the submicron scale. Some of these larger structures show signs of morphological deformation, such as flattened edges, irregular outlines, or partial collapse, which could be attributed to mechanical stress during drying, electron beam interaction, or intrinsic instability of oversized lipid particles. On the other hand, the majority of observed structures appear significantly smaller, with estimated sizes ranging from approximately 150 to 170 nm. In summary, SEM analysis of the sample consistently revealed a predominant population of small, well-dispersed nanoparticles with measured sizes ranging from approximately 150 to 175 nm. These values align closely with the Z-average diameter of 150.4 nm obtained from dynamic light scattering (DLS), suggesting that the technique captures a convergent size profile centered within the low nanometric range. The spherical morphology and smooth surface observed under SEM further support the stability findings in Section 3.8.3. Such uniform particle geometry reduces interfacial stress and minimizes aggregation, which may explain why the formulation remained macroscopically stable under refrigeration and ambient storage conditions (Nguyen VH, 2022).
These morphological characteristics are typical for solid lipid nanoparticles stabilized by non-ionic surfactants. Similar spherical profiles were documented by Beloqui et al. (2017), who emphasized that uniform surface texture enhances dispersion stability and reduces aggregation risk (Beloqui et al., 2017). Likewise, Alloush and Demiralp (2025) observed that spherical SLNs provide improved drug loading efficiency and controlled release, compared with irregular morphologies prone to fusion and sedimentation (Alloush and Demiralp, 2025).
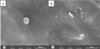 |
Fig. 13 SEM images of the Calophyllum inophyllum L.-loaded SLNs. *Note: Scale bar: 500 nm (a), 2μm (b). |
4 Conclusions
Formulations of TO-SLNs were optimized using a central composite design (CCD) which was successfully implemented to statistically optimize the formulation variables. The effects of four critical formulation variables - HLB value, sonication power, hot homogenization speed, and cold homogenization speed - were systematically evaluated with respect to two key response parameters: Z-average particle size and polydispersity index (PDI). Among several lipid candidates, Naterol® SE was selected as the optimal solid lipid due to its favorable emulsification behavior, stability, and compatibility with the active compound. The optimized SLNs formulation achieved a small and consistent particle size of approximately 148 nm and a PDI of ∼ 0.30, values that are highly desirable for dermal applications. These nanoparticles were found to be physically stable under a range of storage conditions (refrigerated, room temperature, and elevated temperature), demonstrating their robustness for potential commercial use. The optimized formulation demonstrates excellent physicochemical characteristics, potential for enhanced skin penetration, and suitability for topical use.
Furthermore, we propose the optimized TO-SLNs formula as the formula of choice for further investigations of TO as a promising wound healing applications, including entrapment efficiency evaluation and bioactivity confirmation, the SLN-based system holds significant promise for clinical and cosmeceutical applications targeting skin repair and regeneration.
Acknowledgments
This study was supported by Nong Lam University, Ho Chi Minh City, Vietnam.
Funding
This study was funded by the Ministry of Education and Training of Vietnam with the topic "Tinh chế dầu mù u (Calophyllum inophyllum L.) và tạo hạt nano chất béo rắn (solid lipid nanoparticles, SLN) chứa dầu mù u (SLN-dầu mù u)- ứng dụng tạo màng PVA/Pectin)", code: B2025-NLS-03.
Conflicts of interest
The authors have no conflicts of interest to declare that are relevant to the content of this article.
Author contribution statement
Conceptualization: Sao Thi Ly, Anh Cam Ha
Data curation: Ha Vu Le, Thanh-Thuy Thi Nguyen
Investigation, Methodology: Viet Bao Nguyen, Ngoc-Lan Thi Nguyen
Methodology: Thanh-Tra Thi Tran
Writing – Original Draft Preparation: Sao Thi Ly, Thuong-Nhan Phu Nguyen
Supervision: Cang Huynh Mai
Supplementary Material
Figure S1. Effect of solid lipid concentration on PDI.
Figure S2. Effect of HLB on PDI.
Figure S3. Effect of sonication power on PDI.
Figure S4. Effect of hot homogenization speed on PDI.
Figure S5. Effect of cold homogenization speed on PDI.
Figure S6. Overview of Z-Average results.
Figure S7. Overview of PDI results.
Table S1. The physico-chemical properties of Tamanu oil.
Table S2. Fatty acid composition of Tamanu oil.
Access Supplementary MaterialReferences
- Alloush T, Demiralp B. 2025. A review of formulation strategies for cyclodextrin-enhanced solid lipid nanoparticles (SLNs) and nanostructured lipid carriers (NLCs). Int J Mol Sci 26(13): 6509. https://doi.org/10.3390/ijms26136509. [Google Scholar]
- Badawi NM, Teaima MH, El-Say KM, Attia DA, El-Nabarawi MA, Elmazar MM. 2018. Pomegranate extract-loaded solid lipid nanoparticles: design, optimization, and in vitro cytotoxicity study. Int J Nanomed 1313–1326. https://doi.org/10.2147/IJN.S154033. [Google Scholar]
- Ball RL, Bajaj P, Whitehead KA. 2017. Achieving long-term stability of lipid nanoparticles: examining the effect of pH, temperature, and lyophilization. Int J Nanomed 305–315. https://doi.org/10.2147/IJN.S123062. [Google Scholar]
- Beloqui A, del Pozo-Rodríguez A, Isla A, Rodríguez-Gascón A, Solinís MÁ. 2017. Nanostructured lipid carriers as oral delivery systems for poorly soluble drugs. J Drug Deliv Sci Technol 42: 144–154. https://doi.org/10.1016/j.jddst.2017.06.013. [Google Scholar]
- Beloqui A, Solinís MÁ, Rodríguez-Gascón A, Almeida AJ, Préat V. 2016. Nanostructured lipid carriers: promising drug delivery systems for future clinics. Nanomed: Nanotechnol Biol Med 12(1): 143–161. https://doi.org/10.1016/j.jddst.2017.06.013. [CrossRef] [Google Scholar]
- Carlotti ME, Sapino S, Ugazio E, Gallarate M, Morel S. 2012. Resveratrol in solid lipid nanoparticles. J Dispers Sci Technol 33(4): 465–471. https://doi.org/10.1080/01932691.2010.548274. [Google Scholar]
- Cholakova D, Glushkova D, Tcholakova S, Denkov N. 2020. Nanopore and nanoparticle formation with lipids undergoing polymorphic phase transitions. ACS Nano 14(7): 8594–8604. https://doi.org/10.1021/acsnano.0c02946. [Google Scholar]
- Duan Y, Dhar A, Patel C, et al. 2020. A brief review on solid lipid nanoparticles: Part and parcel of contemporary drug delivery systems. RSC Adv 10(45): 26777–26791. https://doi.org/10.1039/D0RA03491F. [Google Scholar]
- Ferdosh S. 2024. The extraction of bioactive agents from Calophyllum inophyllum L., and their pharmacological properties. Sci Pharm 92(1): 6. https://doi.org/10.3390/scipharm92010006. [Google Scholar]
- Gao Y, Meng Z. 2024. Crystallization of lipids and lipid emulsions treated by power ultrasound: a review. Crit Rev Food Sci Nutr 64(7): 1882–1893. https://doi.org/10.1080/10408398.2022.2119365. [Google Scholar]
- Garud A, Singh D, Garud N. 2012. Solid lipid nanoparticles (SLN): method, characterization and applications. Int Curr Pharm J 1(11): 384–393. https://doi.org/10.3329/icpj.v1i11.12065. [Google Scholar]
- Ghasemiyeh P, Mohammadi-Samani S. 2018. Solid lipid nanoparticles and nanostructured lipid carriers as novel drug delivery systems: applications, advantages and disadvantages. Res Pharm Sci 13(4): 288–303. https://doi.org/10.4103/1735-5362.235156. [Google Scholar]
- Håkansson A. 2019. Emulsion formation by homogenization: current understanding and future perspectives. Annu Rev Food Sci Technol 10(1): 239–258. https://doi.org/10.1146/annurev-food-032818-121501. [Google Scholar]
- Hapsari S, Jadid N, Aparamarta HW, Gunawan S. 2023. Impact of solvent type, solvent-water concentration, and number of stages on the extraction of coumarin mixture from tamanu (Calophyllum inophyllum) oil and its antioxidant activity. Arab J Chem 16(2): 104449. https://doi.org/10.1016/j.arabjc.2022.104449. [Google Scholar]
- Khairnar SV, Pagare P, Thakre A, et al. 2022. Review on the scale-up methods for the preparation of solid lipid nanoparticles. Pharmaceutics 14(9): 1886. https://doi.org/10.3390/pharmaceutics14091886. [Google Scholar]
- Mai HC, Nguyen TSV, Le THN, Nguyen DC, Bach LG. 2019. Evaluation of conditions affecting properties of gac (momordica cocochinensis spreng) oil-loaded solid lipid nanoparticles (SLNs) synthesized using high-speed homogenization process. Processes 7(2): 90. https://doi.org/10.3390/pr7020090. [Google Scholar]
- Mehnert W, Mäder K. 2012. Solid lipid nanoparticles: production, characterization and applications. Adv Drug Deliv Rev 64: 83–101. https://doi.org/10.1016/j.addr.2012.09.021. [Google Scholar]
- Miranda-Olvera AD, Domínguez-Esquivel J-M, Martinez J. 2025. Hydrophilic–Lipophilic Balance (HLB) correlation method for the selection of ionic liquid surfactant modifiers of the viscosity and emulsion stability of heavy oils. Langmuir 41(13): 8753–8765. https://doi.org/10.1021/acs.langmuir.4c05309. [Google Scholar]
- Mirchandani Y, Patravale VB, S B. 2021. Solid lipid nanoparticles for hydrophilic drugs. J Control Release 335: 457–464. https://doi.org/10.1016/j.jconrel.2021.05.032 [Google Scholar]
- Mukherjee S, Ray S, Thakur R. 2009. Solid lipid nanoparticles: a modern formulation approach in drug delivery system. Indian J Pharm Sci 71(4): 349. https://doi.org/10.4103/0250-474X.57282. [Google Scholar]
- Müller RH, Mäder K, Gohla S. 2000. Solid lipid nanoparticles (SLN) for controlled drug delivery–a review of the state of the art. Eur J Pharm Biopharm 50(1): 161–177. https://doi.org/10.1016/S0939-6411(00)00087-4. [Google Scholar]
- Nair A, Mallya R, Suvarna V, Khan TA, Momin M, Omri A. 2022. Nanoparticles—Attractive carriers of antimicrobial essential oils. Antibiotics 11(1): 108. https://doi.org/10.3390/antibiotics11010108. [Google Scholar]
- Nguyen VH, T V, Van TV, Dao HA, Lee B-J. 2022. Nanostructured lipid carriers and their potential applications for versatile drug delivery via oral administration. OpenNano 8: 100064. https://doi.org/10.1016/j.onano.2022.100064. [Google Scholar]
- Ohadi M, Shahravan A, Dehghannoudeh N, Eslaminejad T, Banat IM, Dehghannoudeh G. 2020. Potential use of microbial surfactant in microemulsion drug delivery system: a systematic review. Drug Des Devel Therapy 541–550. https://doi.org/10.2147/DDDT.S232325. [Google Scholar]
- Patel D, Patel B, Thakkar H. 2021. Lipid based nanocarriers: promising drug delivery system for topical application. Eur J Lipid Sci Technol 123(5): 2000264. https://doi.org/10.1002/ejlt.202000264. [Google Scholar]
- Pribowo A, Girish J, Gustiananda M, Nandhira RG, Hartrianti P. 2021. Potential of Tamanu (Calophyllum inophyllum) oil for atopic dermatitis treatment. Evidence‐Based Complement Alternat Med 2021(1): 6332867. https://doi.org/10.1155/2021/6332867. [Google Scholar]
- Raharivelomanana P, Ansel J-L, Lupo E, et al. 2018. Tamanu oil and skin active properties: from traditional to modern cosmetic uses. Oléagineux, Corps Gras, Lipides 5(5): D504. https://doi.org/10.1051/ocl/2018048. [Google Scholar]
- Rehman M, Tahir N, Sohail MF, et al. 2024. Lipid-based nanoformulations for drug delivery: an ongoing perspective. Pharmaceutics 16(11): 1376. https://doi.org/10.3390/pharmaceutics16111376. [Google Scholar]
- Sastri KT, Radha GV, Pidikiti S, Vajjhala P. 2020. Solid lipid nanoparticles: preparation techniques, their characterization, and an update on recent studies. J Appl Pharm Sci 10(6): 126–141. https://doi.org/10.7324/JAPS.2020.10617. [Google Scholar]
- Shah S, Madhu H, Soniwala M, et al. 2024. Lipid‐based nanoparticles. Nanocarrier Vaccines: Biopharmaceutics‐Based Fast Track Development, 241–273. https://doi.org/10.1002/9781394175482.ch7. [Google Scholar]
- Sun X, Pan C, Ying Z, et al. 2020. Stabilization of zein nanoparticles with k-carrageenan and tween 80 for encapsulation of curcumin. Int J Biol Macromol 146: 549–559. https://doi.org/10.1016/j.ijbiomac.2020.01.053. [Google Scholar]
- Viegas C, Patrício AB, Prata JM, Nadhman A, Chintamaneni PK, Fonte P. 2023. Solid lipid nanoparticles vs. nanostructured lipid carriers: a comparative review. Pharmaceutics 15(6): 1593. https://doi.org/10.3390/pharmaceutics15061593. [Google Scholar]
- Zhao W, Zeng M, Li K, et al. 2022. Solid lipid nanoparticle as an effective drug delivery system of a novel curcumin derivative: formulation, release in vitro and pharmacokinetics in vivo. Pharm Biol 60(1): 2300–2307. https://doi.org/10.1080/13880209.2022.2136205. [Google Scholar]
Cite this article as: Thi Ly S, Phu Thuong Nhan Nguyen, Anh Cam Ha, Ha Vu Le, Thanh-Thuy Thi Nguyen, Viet Bao Nguyen, Ngoc-Lan Thi Nguyen, Thanh-Tra Thi Tran, Cang Huynh Mai. 2026. Optimization of synthesis conditions for Calophyllum inophyllum L.-loaded solid lipid nanoparticles. OCL 33: 14. https://doi.org/10.1051/ocl/2026004
All Tables
Experimental design matrix and results for SLN-loaded Calophyllum inophyllum L. extract.
All Figures
|
Fig. 1 Effect of solid lipid concentration on particle size (Z-Average). |
| In the text | |
|
Fig. 2 Effect of HLB on particle size (Z-Average). |
| In the text | |
|
Fig. 3 Effect of sonication power on particle size. |
| In the text | |
|
Fig. 4 Effect of hot homogenization speed on particle size. |
| In the text | |
|
Fig. 5 Effect of cold homogenization speed on particle size. |
| In the text | |
|
Fig. 6 3D Response surface of formulation factors on SLNs size. |
| In the text | |
|
Fig. 7 Contour plots of formulation factors on SLNs size. |
| In the text | |
|
Fig. 8 Optimal samples 1 (left) and 2 (right) under refrigeration conditions (0–10 °C) over 2 weeks. |
| In the text | |
|
Fig. 9 Optimal samples 1 (left) and 2 (right) under room conditions (30–33 °C) over 2 weeks. |
| In the text | |
|
Fig. 10 Optimal samples 1 (left) and 2 (right) under room conditions (45–50 °C) over 2 weeks. |
| In the text | |
|
Fig. 11 Z-average particle size of tamanu oil–loaded SLNs during storage at different temperatures. |
| In the text | |
|
Fig. 12 PDI values of tamanu oil-containing SLNs during storage at different temperatures. |
| In the text | |
|
Fig. 13 SEM images of the Calophyllum inophyllum L.-loaded SLNs. *Note: Scale bar: 500 nm (a), 2μm (b). |
| In the text | |
Current usage metrics show cumulative count of Article Views (full-text article views including HTML views, PDF and ePub downloads, according to the available data) and Abstracts Views on Vision4Press platform.
Data correspond to usage on the plateform after 2015. The current usage metrics is available 48-96 hours after online publication and is updated daily on week days.
Initial download of the metrics may take a while.