")
")
| Issue |
OCL
Volume 24, Number 6, November-December 2017
|
|
|---|---|---|
| Article Number | D604 | |
| Number of page(s) | 7 | |
| Section | Bees and Oil- and protein- crops / Abeilles et oléoprotéagineux | |
| DOI | https://doi.org/10.1051/ocl/2017054 | |
| Published online | 04 January 2018 | |
Research Article
Factors of honeybee colony performances on sunflower at apiary scale
Facteurs contrôlant la performance des colonies d'abeilles pendant la miellée de tournesol
1
Inra-BioSP, Domaine St-Paul,
228 route de l'Aéroport,
84914
Avignon cedex 9, France
2
Association de développement de l'apiculture en aquitaine, Maison de l'agriculture,
Cité Galliane, 55 avenue Cronstadt, BP 279,
40005
Mont-de-Marsan cedex, France
* Correspondence: This email address is being protected from spambots. You need JavaScript enabled to view it.
Received:
3
November
2017
Accepted:
20
November
2017
Abstract
An observatory of honeybee colonies (Apis mellifera), consisting of at least 200 colonies, divided into 10 apiaries of 20 colonies, was monitored for three years on sunflower honeyflow (2015–2017). The purpose of this observatory is to understand which factors control colony performance during sunflower honeyflow in south-western France. From the temporal dynamics of weight gain, statistical analysis reveals a hierarchy of factors. First, variability in apiary scale performance is an image of the effect of resource variability. But, in addition to this primordial factor, two other factors contribute very significantly to performance. On the one hand, the amount of capped brood and the number of bees at the time of the installation of the apiary: these two elements testify to the vitality of the colony. The second remarkable factor is the Varroa load, which strongly penalizes performance beyond a certain threshold. The negative effect of the Varroa load on the colony performance is minimized in case of abondant sunflower honey flow.
Résumé
Un observatoire de colonies d'abeilles domestiques (Apis mellifera), constitué d'au moins 200 colonies, réparties en 10 ruchers de 20 colonies, a été suivi pendant trois ans (2015–2017). Le but de cet observatoire est de comprendre quels sont les facteurs qui contrôlent la performance des colonies pendant la miellée de tournesol dans le sud-ouest de la France. À partir de la dynamique temporelle du gain de poids, l'analyse statistique permet de faire apparaître une hiérarchisation des facteurs. En premier lieu, la variabilité de la performance à l'échelle des ruchers est une image de l'effet de la variabilité de la ressource. Mais, en complément de ce facteur primordial, deux autres facteurs contribuent très significativement à la performance. Il s'agit de la vitalité de la colonie représentée par la quantité de couvain operculé et le nombre d'abeilles au moment de l'installation du rucher sur la miellée. Le deuxième facteur remarquable est la charge en Varroa qui pénalise fortement la performance au-delà d'un certain seuil. La pénalisation de la performance due à la charge en Varroa est moindre en cas de miellée de tournesol aboudante.
Key words: honeybee / sunflower honey flow / weight gain / population structure / Varroa
Mots clés : abeille domestique / miellée de tournesol / gain de poids / structure de population / Varroa
© A. Kretzschmar and L. Frontero, Published by EDP Sciences, 2017
 This is an Open Access article distributed under the terms of the Creative Commons Attribution License (http://creativecommons.org/licenses/by/4.0), which permits unrestricted use, distribution, and reproduction in any medium, provided the original work is properly cited.
1 Introduction
The decline in honeybee colony activity is seen almost everywhere in the world. Numerous studies have been conducted on the complexity of the factors thought to be at the origin of this decline. There is a current consensus on the multi-factorial nature of this decline. An additional difficulty is added to this complexity: the great variability that is associated with all the measurements made on the colonies. Several large-scale studies have been conducted on many apiaries (van Engelsdorp et al., 2010; Genersch et al., 2010; Le Conte et al., 2010; Pettis and Delaplane, 2010; Potts et al., 2010). All of these studies encountered the difficulty to bring out a stable and relevant hierarchy of the factors of bee weakening. A long study of lavender honeydew, conducted from 2009 to 2017, showed that at least three main types of factors could be considered: the resource, the dynamics of the bee population and the health factors.
By proposing a general formulation of this model:
 protocols can be built to monitor the performance of professional apiaries during a given honey flow. A first synthesis of the hierarchy of the factors of colony performance on lavender honeydew was presented in 2016 (Kretzschmar et al., 2016).
The opinion of the beekeepers of the South-West of France is that the performance of the colonies has been declining continuously for about ten years. Inspired by the monitoring method and protocols used on lavender, an observatory of honeyflow on sunflower was set up. With the data collected over three years, an initial assessment can be made. The synthesis presented here focuses on highlighting the main factors of honey flow that beekeepers can play.
2 Materials and methods
For three successive years (2015, 2016, 2017), several apiaries (10 in 2015, 18 in 2016 and 10 in 2017) were monitored during the sunflower honey flow. The apiaries are distributed in a sunflower growing area, within a radius of 50 km around the town of Auch (0586721 E, 43.64635 N).
Each apiary had 20 colonies. At the time of the installation of apiaries, at the beginning of honeyflow, the structure of the population of each colony was described by the ColEval method (Maisonnasse et al., 2016). The five parameters evaluated were: the number of bees, the amount of open brood and capped brood, the quantity of food (honey and nectar) and pollen. At the same time, the phoretic Varroa load was measured (Teepol method, Dietemann et al., 2013). The Varroa load is expressed by the VP100ab index: number of Varroa mites per 100 bees.
From the day of the installation, each colony is weighed in full (hive body, supers, cover) every two days. Supers added later are weighed before being installed on hives. The performance of each colony is described by the total weight gain throughout the honey flow. At the end of the honey flow, the hive body and each super are weighed separately for each colony.
All results are analyzed using a GLMM (link function = Identity; random effect: colonies nested in apiaries) model using the {lme4} package of R (R Core Team, 2015).
3 Results
3.1 Annual variation of weight gain
The first global approach makes it possible to distinguish a significant variation in the average level of performance from one year to the next (Fig. 1).
The analysis of variances shows that the three years are very significantly different (2015/2016: p value < 0.001, 2015/2017: p value = 0.00965, 2016/2017: p value < 0.001). As expected, there is considerable variability among all colonies. This average value must therefore be considered as an indication, which although significant, does not adequately reflect the diversity of apiaries.
Additional information, to compare years, is found in the analysis of the change in weight gain in the hive body and in the supers for each year. Here too, the years are significantly different but the variations in the hive bodies and in the supers do not rank in the same way. Although in 2017, the total performance of the colonies is higher than in 2015 (respectively 14.21 kg and 11.43 kg), the performance in supers is higher in 2015 compared to 2017 (respectively 11.78 kg and 8.45 kg, p value = 0.00178). As a corollary, the hive body gain in 2017 is much higher than that observed in 2015, respectively (5.77 kg and −0.33 kg, p value < 1e–04)(Figs. 2 and 3).
The respective variations of the four main factors are represented on Figure 4. The number of bees and the quantity of capped brood followed the same variations. The lesser area occupied by food in 2017 could have impaired the development of populations. Interestingly, the Varroa load followed the same variation as the quantity of brood (Fig. 4).
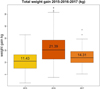 |
Fig. 1 Variation of the weight gain of the complete hive per year of honeybee colonies during sunflower honey flow in 2015, 2016 and 2017. |
 |
Fig. 2 Variation of the weight gain of the supers per year of honeybee colonies during sunflower honey flow in 2015, 2016 and 2017. |
 |
Fig. 3 Variation of the weight gain of the body hive per year of honeybee colonies during sunflower honey flow in 2015, 2016 and 2017. |
 |
Fig. 4 Annual variation of the four main colonial factors influencing the performance of honeybee colonies per year of honeybee colonies during sunflower honey flow in 2015, 2016 and 2017. |
3.2 Variations of performance between apiaries
To approach the study of performance factors at the apiary scale, we study the variability between apiaries for each year (Fig. 5). We see the great disparity between apiaries that will lead to analyse the interpretation of the factors of this variability. The three years have significantly different patterns of variability, as it is depicted by the variance reported for all apiaries for 2015, 2016 and 2017: 73.546, 138.015 and 43.965, respectively.
 |
Fig. 5 Variations of the weight gain of the complete colonies for three successive years (2015, 2016 and 2017) at the apiary scale. |
3.3 Colonial parameters (bees an brood)
The study of the variability of the population structure at the hive scale and, on average, at the scale of the apiaries also reveals a great diversity between the apiaries (Fig. 6). This diversity in the organization of the colony can be regarded as the mark of the beekeeper (preparation work, exploitation), but also as a consequence of the honeyflow that precedes sunflower honey.
The analysis of annual variations shows that the number of bees is significantly lower in 2015 compared to 2016 and 2017 (respectively: 11 322, 18 924 and 17 019, 2015/2016: p value < 1e–04 n = 200/260 – 2015/21017: p value < 1e–04; n = 200/200 – 2016/2017: p value = 0.0154 NS; n = 260/200). Contrarily, the number of capped brood cells is greater in 2016 and not significantly different between 2015 and 2017 (2015–2017/2016 p value>1e–03, 2015/2017: p value = 0.152, NS).
 |
Fig. 6 Variations of the number of bees per colonies for three successive years (2015, 2016 and 2017) at the apiaries scale. |
3.4 Varroa load
The measurement of the Varroa load at the beginning and at the end of the honey flow shows a significant increase in the number of Varroa mites per 100 bees during the honey flow. This increase is more evident for the year 2016. In general, the load in Varroa is below the threshold of 3 VP100ab; this threshold was defined (on the lavender honey flow) as the maximum beyond, which the performance of the colonies began to be penalized. In 2015 as in 2017, the majority of colonies remain below this threshold during all the honey flow. In 2016, most apiaries exceeded this threshold at the end of honey flow (Fig. 7).
 |
Fig. 7 Variation of the Varroa load (VP100ab) at the beginning and at the end of sunflower honey flow for three years (2015, 2016 and 2017) at apiary scale. |
3.5 Analysis of the hierarchy of the factors of the performance
A first mixed model reveals the major factors of performance. For facilitating the convergence of the models, the number of bees and the number of capped brood cells have been divided by 100.
Model A: performance = year + number of bee + number of capped brood + food + Varroa + random factors (Hive | Apiary).
A second model investigates the influence of fixed factors related to the colony (number of bee, number of capped brood, food and Varroa) with the same random factors (hive | apiary). This model is applied each year independently.
Model B: performance = number of Bee + number of capped brood + food + Varroa + random factors (hive | apiary).
In Table 1, the prioritization of factors is clearly marked. The factor that is most often the most important is the amount of capped brood that represents the bees to be born and that will participate in the honey flow. This result is consistent with what has been shown on the factors influencing the performance of colonies of lavender honey flow. The second factor to be very significantly involved in performance is the number of bees. These two criteria are descriptors of colony dynamics. The amount of food in the body of the hive is significant only for the year 2016. It can be understood as a competition for the space between the laying capacity of the queen and the preservation of space for the reserves. Finally, the negative influence of Varroa load is significant in the global model (Model A) and in the annual model (Model B) in 2016. This result confirms that when the load is low (Fig. 4), it has no effect on performance.
Despite the importance of these factors in explaining the variation in performance between apiaries, it should also be noted (Tab. 2) that about half (or more) of the variability is associated with the random components represented by hives grouped in apiaries. The “apiary factor” contains both an environmental component and a beekeeping component that is related to each apiculturist's management.
Coefficients and significant levels for the different factors of the general model with years as factor (Model A) and the models with factors for each year independently.
Variance due to the random factors. The variance of Group Factor “Apiary” described the high level of the variability explained by the difference between apiary.
4 Discussion
The analysis of the performance factors of honeybee colonies during sunflower honey flow leads to two contrasting findings.
First, the fundamental importance of two factors describing the quality of the colony is pointed out by the monitoring and the analysis of these three years. First, the amount of brood and then the number of bees. Colonies arriving early on honeydew with a growth dynamic are in condition to achieve a good performance. These are components of the colony that the beekeeper can strongly influence.
In addition, these results confirm that the control of the Varroa load has a significant impact on performance. This confirms the overall result obtained by colony studies during lavender honey flow (Kretzschmar et al., 2016). It should be noted however that, with the data presented here, the negative effect of a high Varroa load only becomes significant if the honey flow is quite important. It is remarkable that the negative effect of the Varroa load is not detectable in 2015 and 2017. On the one hand, the Varroa loads of most apiaries in early honey flow were below the threshold of 3 VP100ab. On the other hand, 2015 and 2016 are years of poorer performance where the negative effect of Varroa mites may not appear.
It therefore seems that when the conditions of the honey flow are not good, the advantages linked to a strong dynamics of the colonies do not appear.
Secondly, as a consequence of the above, the importance of random factors in the models describing the performance shows that the resource component is very poorly investigated by this approach. The combined importance of annual variations and the apiary factor is an indication that annual or local variations (for the same year) account for a large part of the variation in performance.
The search for the prioritization of factors that influences colony performance is an approach that can effectively contribute to developing recommendations for beekeepers to properly prepare colonies. But, as we see in the results presented here, when the resource is sufficiently available for the demographic potential of the colony to express itself, control of the load in Varroa to avoid its penalizing effect becomes the main lever. In less favorable honey flow conditions, the colonies do not have the means to express their potential and the beekeeper's room for playing his role is smaller. A last remark on the low number of years of this observatory of sunflower honey will moderate the above conclusions until the data of the coming years consolidate these results.
References
- Dietemann V, Nazzi F, Martin SJ, et al. 2013. Standard methods for Varroa research. J Apicult Res 52(1): 1–54. [Google Scholar]
- Genersch E, von der Ohe W, Kaatz H, et al. 2010. The German bee monitoring project: a long term study to understand periodically high winter losses of honey bee colonies. Apidologie 41: 332–352 [CrossRef] [EDP Sciences] [Google Scholar]
- Kretzschmar A, Maisonnasse A, Dussaubat C, Cousin M, Vidau C. 2016. Performances des colonies vues par les observatoires de ruchers. Innov Agron 53: 81–93. [Google Scholar]
- Le Conte Y, Ellis M, Ritter W. 2010. Varroa mites and honey bee health: can Varroa explain part of the colony losses? Apidologie 41(3): 353–363. [CrossRef] [EDP Sciences] [Google Scholar]
- Maisonnasse A, Hernandez J, Le Quintrec C, Cousin M, Beri C, Kretzschmar A. 2016. Évaluation de la structure des colonies d'abeilles, création et utilisation de la méthode ColEval (Colony Evaluation). Innov Agron 53: 27–37. [Google Scholar]
- Pettis JS, Delaplane KS. 2010. Coordinated responses to honey bee decline in the USA. Apidologie 41(3): 256–263. [CrossRef] [EDP Sciences] [Google Scholar]
- Potts SG, Roberts SPM, Dean R, et al. 2010. Declines of managed honey bees and beekeepers in Europe. J Apic Res 49: 15–22. [CrossRef] [Google Scholar]
- R Core Team. 2015. R: A language and environment for statistical computing. Vienna, Austria: R Foundation for Statistical Computing. http://www.R-project.org/. [Google Scholar]
- van Engelsdorp D, Meixner MD. 2010. A historical review of managed honey bee populations in Europe and the United States and the factors that may affect them. J Invert Pathol 103: S80–S95, ISSN 0022–2011, DOI: 10.1016/j.jip.2009.06.011. [Google Scholar]
Cite this article as: Kretzschmar A, Frontero L. 2017. Factors of honeybee colony performances on sunflower at apiary scale. OCL 24(6): D604.
All Tables
Coefficients and significant levels for the different factors of the general model with years as factor (Model A) and the models with factors for each year independently.
Variance due to the random factors. The variance of Group Factor “Apiary” described the high level of the variability explained by the difference between apiary.
All Figures
|
Fig. 1 Variation of the weight gain of the complete hive per year of honeybee colonies during sunflower honey flow in 2015, 2016 and 2017. |
| In the text | |
|
Fig. 2 Variation of the weight gain of the supers per year of honeybee colonies during sunflower honey flow in 2015, 2016 and 2017. |
| In the text | |
|
Fig. 3 Variation of the weight gain of the body hive per year of honeybee colonies during sunflower honey flow in 2015, 2016 and 2017. |
| In the text | |
|
Fig. 4 Annual variation of the four main colonial factors influencing the performance of honeybee colonies per year of honeybee colonies during sunflower honey flow in 2015, 2016 and 2017. |
| In the text | |
|
Fig. 5 Variations of the weight gain of the complete colonies for three successive years (2015, 2016 and 2017) at the apiary scale. |
| In the text | |
|
Fig. 6 Variations of the number of bees per colonies for three successive years (2015, 2016 and 2017) at the apiaries scale. |
| In the text | |
|
Fig. 7 Variation of the Varroa load (VP100ab) at the beginning and at the end of sunflower honey flow for three years (2015, 2016 and 2017) at apiary scale. |
| In the text | |
Current usage metrics show cumulative count of Article Views (full-text article views including HTML views, PDF and ePub downloads, according to the available data) and Abstracts Views on Vision4Press platform.
Data correspond to usage on the plateform after 2015. The current usage metrics is available 48-96 hours after online publication and is updated daily on week days.
Initial download of the metrics may take a while.